


Cape Water and Dams Report
 (Lakenvallei Dam. Now 74% full. Photo : DWS)
Dams – Latest levels: Winelands and Cape Town
Report nr. 124 (updated 22nd October 2018) on the main dams serving
Cape Town City and nearby Boland/Overberg towns
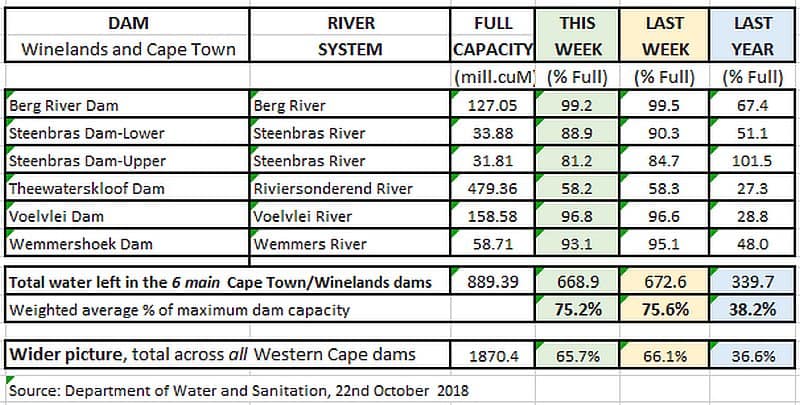
Net outflows from the dams increased last week to 3.7 M.cuM (0.4% of capacity). Total water stored fell from 75.6% to 75.2% of capacity.
Last year due to useful rain in the same week, levels increased by 10.3 M.cuM (0.4%) to reach 38.2% of capacity.
Here is the weekly net change in the total amount of water stored in the 6 main dams .
 It is interesting that last week was only the second week in the past 52 weeks where the dams showed a greater weekly decline than occurred in 2017.
Seeing that the weather forecast predicts very little rain by this month-end, I have made a mid-month correction and changed the previously predicted net inflow in the following chart to a net outflow of 7 M.cuM for October. This reflects the fact that the winter seems to be fully over and that rapidly rising temperatures will be adding to rates of evaporation.
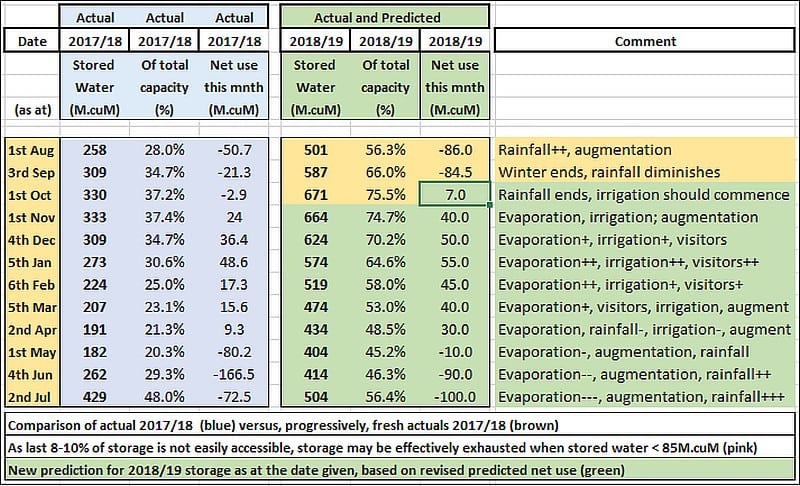 (Here is our model projecting the amount of water likely to be stored in the dams each month)
It now remains to be seen what changes in DWS’ water allocations will be applied in November after their model runs at the end of October. It is sincerely hoped that they grant agriculture its full normal allocation of 160 M.cuM; the figures above assume that this will be the case.
Putting it into context!
Now that we appear to have topped out at the maximum water in storage for this year, some readers have become concerned and believe that the level-6 restrictions should be continued. They seem to fear that over-use of water could confront us once more with a “Day Zero” scenario and wish to avoid that happening.
This is a natural response given hardship of the strict limits on water use over the past 12 months. However, as long as the authorities maintain some restrictions on water use, there is no practical reason why we would suddenly run out of water. Why is that? Well nature has just delivered to us in excess of 18 months water supply at higher water usage rates, and this is more than enough to see us through for another year.
The fact is that even if in winter 2019 we receive only the same miserable 170 M.cuM dam recharge that we received in winter 2017, we will still have enough water stored to see us through to winter 2020, a year and a half from now! And if the dams recharge by a more normal 300+ M.cuM in winter 2019, then there will be no problem whatsoever.
The authorities have recognized this and therefore already eased restrictions slightly in October. I believe that after the DWS water allocations are made in early November, restrictions may be wound back to level-4 or perhaps even level-3. At the same time the extra water use would bring a further reduction in the water tariffs; a relaxed, lower cost arrangement that would be good for all. We should not become complacent but there is also no point in making our lives harder than they absolutely need to be.
But the choice is yours alone. Consume less water and minimise your costs. Or relax to the full extent that the eased restrictions permit (hopefully some garden watering will once more soon be allowed) and enjoy a far more normalized life, albeit at a slightly higher total monthly cost.
If you disagree then please do run Piotr Wolski’s “Big Six Dams Monitor model”. You will find it here. It is very simple to use. Load in what you believe will be realistic rainfall and consumption factors and see for yourself what the predicted dam levels will be over the coming two years.
I believe that the authorities will proceed with due caution. They are now far more skilled at managing water shortages and should be relied on to ease only gradually, making full use of pressure management and building in augmented supplies of water as extra production ramps up.
What about water pressure?
An interesting question asked by James van Vuuren – what will happen to pressure settings as restrictions are eased?
My understanding is as follows:
1) The present aim is to have around 1.5 bar of pressure (i.e. able to lift the water 15m high) available 24/7 at the water inflow point to properties. It is “aggressively managed” to meet this standard in residential areas.
2) The water pressure is generally increased between 06:00 and 10:00 each day to allow for the peak demand and also to reach double stories (City by-laws state that owners of buildings are responsible to get water to all higher stories of buildings). However, in hot weather consumption increases which may cause local pressures to appear to drop.
3) It is expected that as restrictions ease, water pressure will gradually be stepped up, but cautiously to ensure that bursts and leaks remain controlled. Water pressure management is estimated to have saved up to 60 ML/day of water use, and it may be expected to be managed in a way that maintains this contribution. In time it is intended to build general water pressure to 2.0 bar.
4) Currently about 45% of the 10,600 km of water mains in the City reportedly is pressure managed. It could in time reach 58% or 6210 km. This means that pressure management will be finer and more sensitive in some areas of the metro than others.
What of augmentation, the production of extra potable water?
It is already so that almost one in every 10 glasses of potable water that you drink or use right now comes from sources other than the main dams. By mid-2019 that should rise to two to three glasses out of every ten. We have been and will continue paying for this extra water production, so why not relax and enjoy using the available water (it is currently between 35 and 45 ML/day and by mid-2019 should climb to over 150 ML/day).
The augmented water supply this past week was only 35 ML/day. Consumption from “all sources” reduced to 556 ML/day (down from 563 ML/d) while water drawn from the main dams stood at 521 ML/d. The reversed trend is sure to bounce around for a while before stabilising and could more closely approach the 500 ML/d target set by the Metro.
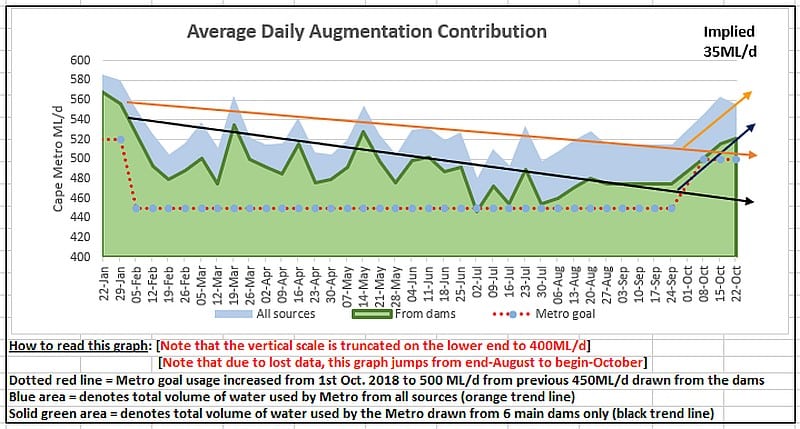 (Graph tracking overall use and production of extra water through the augmentation efforts)
Read full report on status of Cape Town’s augmentation efforts here.
How well are we actually doing overall?
This CoCT graph shows that we have probably passed peak water storage for 2018.
To my mind the “danger” and “critical” zone levels shown in this graph are set too high. Their shape implies that they will continue climbing but in fact the zones should be reshaped to taper off as the summer progresses. Hopefully the Metro team will reshape them as they shift the graph forwards.

Brandvlei Dam dropped slightly to 60.9% (61.6%) and Kwaggaskloof Dam is at 59.4% (59.8%) of capacity. Clanwilliam Dam is full at 98.7% (99.5%) with Bullshoek Dam standing at 97.4% (97.6%). Meanwhile the Klein Karroo and Gouritz area gets drier and drier.
The overall level of all dams in the Western Cape dropped slightly to 65.7% (66.1%).
Will the weather help?
Rainfall this October has been disappointing, especially in the catchments of the largest dams. Our chart shows cumulative rainfall for the month-to-date as was recorded at the dams.
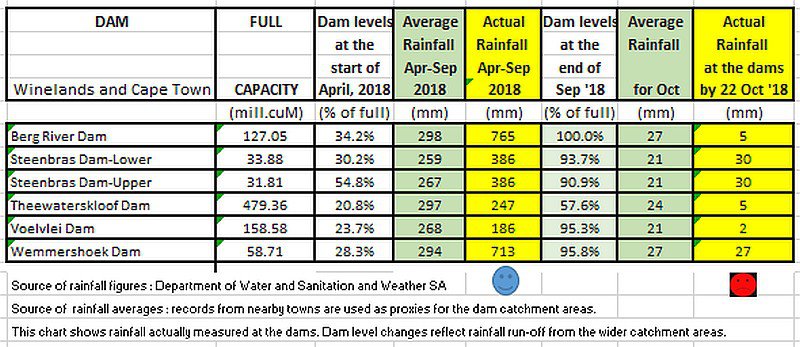 .
.
What rain ought we to now expect?
At this time there is nothing significant in the forecasts for the SW Cape through until Xmas. Obviously this can change at any time and purely statistically there will be some rain from time to time. Also at this time of year there is always the chance of a cut-off low bringing thundery weather.
What does seem to be emerging however is that we are in for a sustained hot, dry period with maximum temperatures breaking all records for this time of year.
The rainy spells that are forecast amounts to no more than a statistical possibility.

El Nino, now commencing, points to drier conditions inland during summer. Happily, this El Nino is forecast to be mild (not above + 1.2 degC) but it may persist into Autumn and delay onset of the 2019 Cape winter.
.
Click here to see ShowMe Winelands Weather forecast of possible near-term rain.
.
What are the authorities doing?
The City of Cape Town’s announced that the Mayoral Committee has recommended that Council approve a multi-year project to more than double the current capacity of the Potsdam Wastewater Treatment Plant located along Koeberg Road. It is envisaged that over the next six years this plant’s current wastewater treatment capacity of 47 million litres per day will be expanded by 53 million litres to total 100 million litres per day to cope with population expansion. This could in time become a source of recycled water.
The City of Cape Town hosted two hundred children at a climate change school holiday programme this week. The aim of the programme was to raise awareness about climate change, its impact on weather and the environment and what learners can do to help mitigate the risks.
.
What ought you to be doing?
As we move forward into this ‘New Normal’, there are some things that we all should do to reshape our long-term relationship with water. It really is all the obvious stuff!
1) Take the trouble to see that your incoming water meter stops turning when all taps in the house are closed. If it doesn’t there is probably a leak, so call in a plumber and fix it. Why waste water?
2) Check all your toilet mechanisms to make sure that they haven’t become gummed up or stuck through the use of grey water. If you elect to now allow your toilet cisterns to fill in the normal way, ensure that that the flushing mechanisms close off firmly without any leaks into the bowl (fill, mark the level and check later that the water level has not dropped).
3) If it works for you, continue showering instead of bathing and still apply stop/start water flow to minimise water used. To whatever extent is convenient to you, collect grey water and continue to use it to supplement toilet flushes and for watering plants. Ditto water from your washing machine.
4) Look long and hard at the garden. If you kept your trees and shrubs alive with grey water, good work. Think hard if you really need as much lawn as before and, if you do, consider swapping Kikuyu to Buffalo grass. Grass is very thirsty and can easily be substituted by gravel patches, ground covers and indigenous succulents to reduce overall water needs. Ask your nurseryman’s advice.
5) Consider installing a water tank and/or possibly building a pond or sump where one can collect surplus rainfall run-off. This extra water will forever be useful and will pay for itself several times over the life of the installation in saved water costs. [I will return to this issue next week].
I feel that our long-term goal should generally be to get by with just 90-100 L/person/day drawn from the municipal system (vs the average 250 L/p/d used back in the bad old days) with grey water re-use and own rain storage facilities supplying the gardens and for other external use. A structured approach like this should also allow one to cut back quickly again should deep restrictions once more prove necessary. Let me know what you think.
Summary: Combined levels of the main reservoirs serving the Cape Town/Overberg/Boland area fell from 75.6% to 75.2% of capacity. No significant rain is forecast.

Read about Cape Town’s Augmentation fresh water production program here.
Read our Indoors Water Savings Ideas here.
Read our Outdoors Water Savings Ideas here
Read about a D-i-Y household rainwater harvesting and tank system here
Tom Brown.
Retired international businessman with a background in Finance and IT; and now a fruit farmer, with a passion for the weather and climate.
Views expressed in this article, and comments in response, are those of the writer and commenters alone and do not necessarily reflect the views and opinions of ShowMe, nor is any warranty hereby given as to suitability for any purpose of a reviewed enterprise or as to the quality of offered advice, products, services or value. Copyright ShowMe Paarl. All rights reserved. Copy only with prior permission.
Related Articles


