


Cape Water and Dams Report
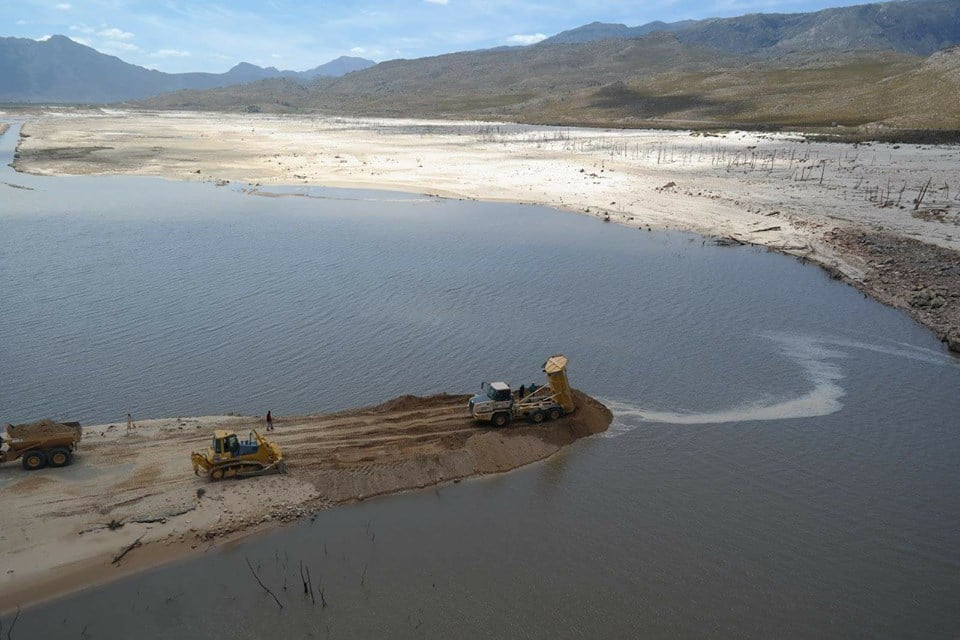 (Berm being built across Theewaterskloof Dam, photo: Nina Ganci)
Dams – Latest levels: Winelands and Cape Town
Report nr. 89 (updated 12th February 2018) on the main dams serving
Cape Town City and nearby Boland/Overberg towns
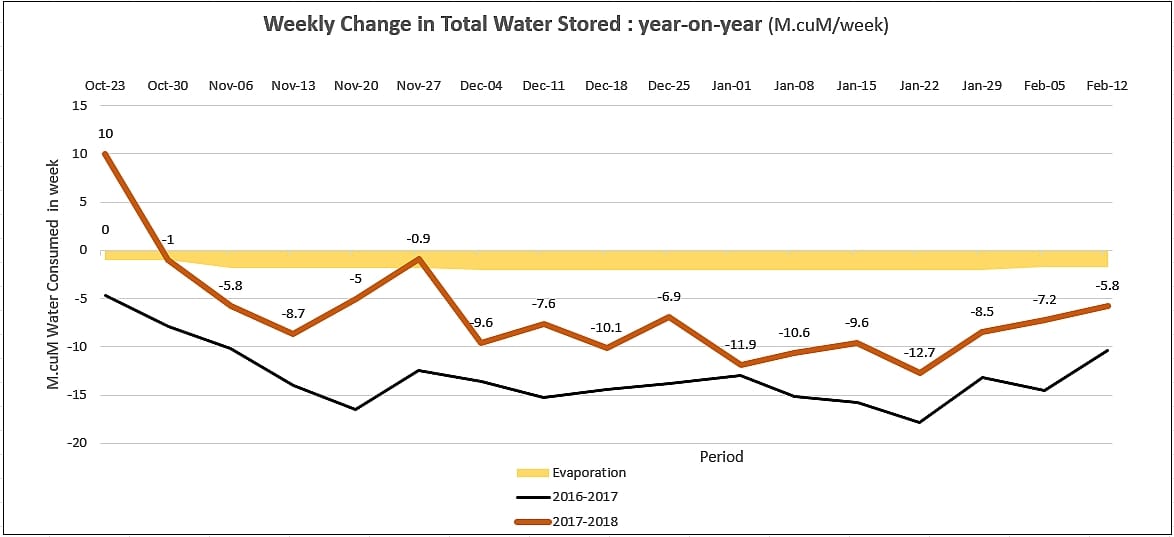
Last week, net outflows from the main dams dropped further to 5.8 M.cuM, or 0.7% of total dam capacity; vs the preceding week’s higher 7.2 M.cuM. Combined dam levels dropped during last week from 25.2% of capacity to 24.5% of capacity
In 2017, the main dams dropped by a far larger 10.4 M.cuM, falling 1.2% to 35.7% of full capacity.
Current status?
Combined water stored in the 6 main dams fell to 218.1 M.cuM (133 M.cuM of easily accessible water) (last year, levels dropped to 317 and 235 M.cuM respectively over the same period).
How long will the remaining fresh water last?
It is now clear that DWS has cut the use of water for irrigation purposes at or about the agreed 40% level. At the same time, the non-agricultural use of water has also dropped sharply as the new level-6b restrictions come into effect. According to my calculations, this past week the use of 5.8 M.cuM of water from the dams could probably have been split more or less as follows:
- metro 3.6 M.cuM,
- evaporation 1.7 M.cuM
- other municipalities 0.4 M.cuM
- residual agriculture 0.3 M.cuM
- assume some rainfall run-off -0.2 M.cuM
Therefore the main target remains to drive use in the Metro down to the target of 450 ML/day and together with the other smaller municipalities down to a combined result less than 500ML/day.
The main irreducible current cause of the weekly drop in the combined dam levels is evaporation. Fortunately, evaporation will begin to decline as the ambient temperatures start to fall. By April it will be less than half of what it is now, and by June it will have halved again.
Of course a major once-off positive contributor over the coming 6-8 weeks will be water transferred from the Groenland Water Users Association pumped across into Steenbras Dam. This is expected to amount to some 8-10 M.cuM of fresh water, which should add two week’s supply to the WCWSS for the Metro and other municipalities. A life-saving, selfless donation by those farmers.
This unexpected inflow of water taken together with continued reduction in water use by residents indicates that water currently stored in the dams could well last until between mid- and end-June before the implementation of stage-2 (collection/rationing) of water supplies may be required.
The chart below indicates the position at the start of February. It is too early for a mid-month correction but the early indications are that my currently predicted water consumption for the month will again prove to be too high and that in February we will use less water than the 37.8 M.cuM expected. Remember also that the red block indicates that point where, had our water usage followed the same pattern as last year, we would already have hit “Day Zero”.

What actually is going on?

1) As this CoCT graph shows, most agricultural use of water has been closed off by DWS and the earlier steep rising usage curve is now starting to “flat-line” at/about the set maximum of 58 M.cuM for the total water used. Other than remaining pockets of unused quotas, use of water from the main dams by agriculture is all closed for this season.
2) It may be seen from the photo at the head of this report that DWS is modifying Voelvlei and Theewaterskloof dams to enable part of the water that lies in the deepest part of the dams to be pumped up to the level of the abstraction points, so that more of the water can be made available for the Metro and municipalities. At TWK (shown) the work involves creating a temporary berm to hold flows from the Sonderend River at a higher level for easier abstraction. Should these natural flows be insufficient, then more water will be pumped up from below this temporary berm to above it so that water can be sent through to the Berg River side. Through these modifications, DWS expects to be able to draw both these dams down to about 6% of capacity should that become necessary.
3) Residents of the Metro and other smaller municipalities are obviously making great strides to reduce their consumption of fresh water. As a result, Cape Town City which until recently seemed so stuck at a usage of 600ML/day has over a few weeks dropped sharply to ave 493ML/d during this past week. This is an outstanding result and shows just how well the residents are reacting to the call to use less water. The goal is to as soon as possible get this daily consumption down to 450ML/d or less. And it seems to me that could be achieved before end-February. We done everyone.
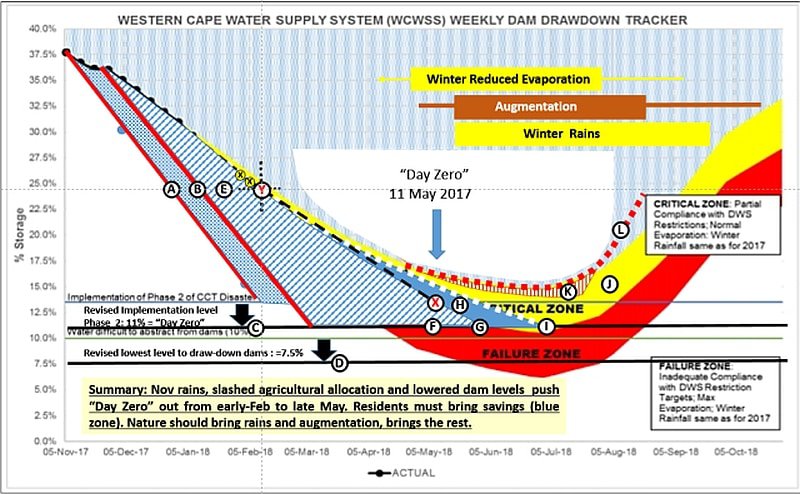
The following heavily altered CoCT tracker chart shows in overall terms what is going on (see here for a detailed explanation of how the chart is to be read).
City of Cape Town held its prediction of “Day Zero” at 11th May 2018 (point red ‘X’ in the chart). Although CoCT remains conservative in its estimates, this may be adjusted soon to a yet later date.
We are today at point red ‘Y’ (24.5% of capacity on 12th February). However, we are not only benefiting from the savings made by agriculture (the blue striped zone “E”, but more importantly as anticipated residential water usage reductions kick in (the blue-shaded zone “H”) we are starting to follow the curving dotted white line, trending toward point “I” on the revised lower line “C” at which the authorities would have to implement stage-2 collection/rationing of the disaster plan.
Our hope then is that winter rains together with early water production from augmentation initiatives (area “K”) will lift us on to the red dotted line “L” denoting steady recharge of the dam storage.
Therefore, I would like to suggest that instead of the dark negativity of “Day Zero” we now set ourselves a positive fixed target that we call “Success Day” and make that target getting to 30th June with at least 100 M.cuM of water left in the main dams. This would represent about 11% of capacity and, assuming that the DWS is indeed prepared to drop the dam levels down to 6-7%, would leave a safety margin of some 4-5%; so that even if we receive no rain at all there would still be enough water in the dams to support a stage-2 rationing program through until end-2018 by which time a number of augmentation initiatives will be producing extra water to relieve the situation.
In support of this notion of “Success Day” the present augmentation plans comprehend the production of 80ML/day of fresh water by July and 180ML/day of fresh water by December 2018.
More positively, if we can reach end of June with that much water still available, then we will be well into the rainy season and even with weak winter rainfall, recharge of the dams would have begun.
What are the authorities doing now?
The City of Cape Town reports that 526 ML/day of water was consumed from all sources but that it only used 493 ML/day drawn from the main dams. This implies that the augmentation initiatives have progressed to the point that they are producing the difference i.e. 33ML/d of fresh water.
The Metro has embarked on a massive information campaign using all possible ways to make the broader population aware of the problem and encouraging them to save water.
The Metro is also developing a program of volunteers to assist with the many tasks that will have to be dealt with if water supply to the taps is cut off, such as assisting at water collection points and caring for the most vulnerable. Read more here to see how you might apply to help.
The level-6b restrictions and sharply increased tariffs appear to be having a marked effect in encouraging less use of water. This is supported by further roll-out of pressure reduction systems to reduce losses through piping and system failures.
CoCT has announced that it intends to release details of the Points of Distribution on Sunday 18th February. Sensibly, work on these expensive installations will be delayed until the last possible moment, in the hope that they are not needed at all.
The two initial temporary desalination plants at Monwabisi and Strandfontein are reported to be about 70% complete and should start producing fresh water next month. On the other hand, work on the V&A desalination plant has been delayed by intervention of the DWS Minister wanting a desalination unit from Durban to be installed there.
Drilling into the Cape Flats and TMG aquifers is proceeding.
DWS is making rapid progress on constructing the berm and pumping installations at Voelvlei and Theewaterskloof dams. It should be noted the cost of this work, being R12-15 million in each case, has been funded by DWS.
Cooperative Government and Traditional Affairs Minister Des van Rooyen stated that central government is working on the possible proclamation of a national state of emergency. To date three provinces (Western, Eastern and Northern Cape) have been declared local disaster zones, but this planned escalation would mobilise more resources of the state to assist all parts of the country facing the widening shortage of water.
See details of Cape Town’s planned interventions to produce fresh water here.
Learn about water savings efforts by other Cape municipalities – read more here.
Hear me interviewed on Bok Radio here about the overall water situation in the western Cape
Do visit the City of Cape Town website to see additional graphically presented information regarding the water situation – very helpful.
1) See the full water status presentation here and
2) Check out water usage for your property and of neighbours, friends, using this interactive map.
What ought you to be doing?
1) Be “water warriors” at home and at the place of work. Make extra efforts to cut down on all possible use of water. By using a basin and large sponge, reduce the water used to shower to under one litre. One can do this daily with hair washed and oneself totally cleaned. All one gives up is the luxury of standing under a hot shower; a small price to pay for water security.
2) Join dependable social media groups and form local WhatsApp groups so as to stay in touch and benefit from tips and suggestions on how to reduce use of water. Have a look at this link.
3) Take care of personal hygiene and reduce health risks. Treat grey water being saved for flushing with Jik or vinegar to prevent smells and possible spread of bacteria. Wash hands regularly.
If you are a business owner or manager, I strongly recommend that, if you have not already done so, meet with your employees and take them into your confidence regarding what you believe may happen to your business as this situation unfolds. The situation is unprecedented and no one will have points of reference or past experience to draw upon. Employees are likely to be concerned and perhaps even fearful about their jobs, incomes and how they will cope.
By discussing the matter you would simultaneously make them all fully aware of the seriousness while encouraging their participation in implementing ways to cut down on water usage and may even generate good ideas on how to mitigate the possible negative impact of water rationing. One concept to consider – if it would be appropriate in the event of a possible slow-down or loss of some business – is to perhaps adopt a policy of work-sharing where those working in the same departments or doing the same work could between them share whatever reduced work might still be available in return for flex-time time off while earning proportionately reduced incomes. The main advantage being that some familiar work is far better than none.
Will the weather help?
 Well, as predicted, that cold front came through last weekend and variable amounts of rain fell across the SW Cape. Gratifyingly some rain fell in all the dam catchments. Run-off will already have reached dams with more to come. A good 33 mm of rain was measured at Dwarsberg which feeds the Berg River and TWK dams.
As I write there is a low pressure system north of Cape Town feeding rain with the possibility of thundershowers from the North West down towards Agulhas. Rains could be fairly widespread as this chart from NOAA/CPC indicates, with the possibility of stronger rainfall behind the mountains in the catchments area of the large dams. If you are lucky enough to be under a cloud …
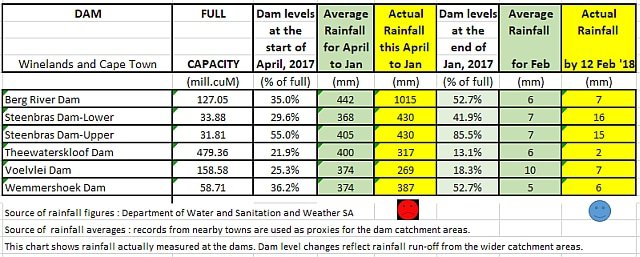
Here is the rainfall chart for the dam catchments for the period since 1st April 2017. This tracks rainfall that is measured actually falling at the dams.
In Summary: outflows exceeded inflows by 5.8 M.cuM and combined dam levels fell to 24.5%.
Here are the levels of the six main dams serving the Cape Town/Overberg/Boland area.

Here are some of our updated thoughts of possible implications of “Day Zero”.
Plan ahead for possible water outages; here are points that could help.
Read our Indoors Water Savings Ideas here.
Read our Outdoors Water Savings Ideas here
Read about a D-i-Y household rainwater harvesting and tank system here
Read about South Africa’s desalination policies and initiatives.
Click here to see Winelands Weather forecast of possible near-term rain.
Report instances of piping failures and incorrect use to municipalities.
In Cape Town the contact details of the 24-hour Technical Operation Centre are: Email: waterTOC@capetown.gov.za Telephone: 0860103089 (choose option2: water-related faults) or SMS: 31373 (max 160 characters).
Tom Brown.
Retired international businessman with a background in Finance and IT; and now a fruit farmer.
Views expressed in this article, and comments in response, are those of the writer and commenters alone and do not necessarily reflect the views and opinions of ShowMe, nor is any warranty hereby given as to suitability for any purpose of a reviewed enterprise or as to the quality of offered advice, products, services or value. Copyright ShowMe Paarl. All rights reserved. Copy only with prior permission.
Related Articles


