


Dams – Latest levels: Winelands and Cape Town
 (Steenbras Dam. Photo City Cape Town)
Latest report (updated 22nd January 2018) on the main dams serving
Cape Town City and nearby Boland/Overberg towns
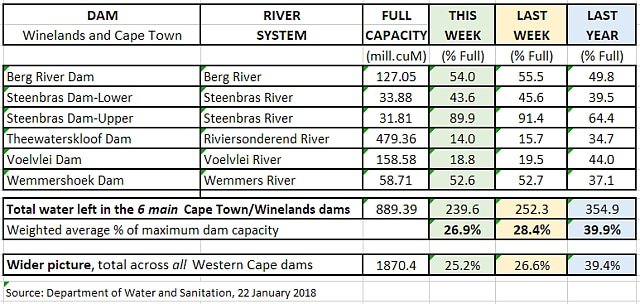
Water consumption spiked last week to 12.7 M.cuM, 1.4% of total dam capacity; vs the preceding week’s 9.6 M.cuM. Combined dam levels dropped from 28.4% of capacity to 26.9%.
During the same period in 2017, the main dams dropped by a far larger 18.9 M.cuM, with the dams sinking back then by 2.1% to 39.9% of full capacity.
What are we to make of this? Looking back it seems that in previous years, during this week in which people return from holidays and businesses and schools restart, water consumption tends to spike, subsequently dropping back to more stable rates over the following weeks. Additionally it was a very hot week so evaporation will have also climbed. So is this a new higher consumption trend? It doesn’t seem so. This view is reinforced by the fact that the actual consumption last week at 12.7 M.cuM was anyway only 2/3rds of the 18.9 M.cuM consumed in the same week, a year ago in 2017.

Current status?
Combined water stored in the 6 main dams fell to 239 M.cuM (154 M.cuM of easily accessible water) (last year, levels dropped to 355 and 270 M.cuM respectively over the same period).
How long will the remaining fresh water last?
Water consumption is gratifyingly lower than same time last year, but is still far higher than desired. But more and more conflicting and increasingly sensational articles and comments are flying around. Do take time to understand properly so that you can prepare yourself in the light of facts not rumours.
Simply; we have to keep saving water – hell is chasing us. As you will see below the difference between probably squeaking safely through instead of slamming hard into Day Zero, is very narrow. It is up to us and everyone that we know in SW Cape to save every drop of water that we can. Many people are already doing a tremendous job, but we have to try harder. It will be far better to get 50L/p/d out of your taps than having to queue to collect and carry 20L per person each.
My assessment is that barring some unforeseen event, there is a high probability that the water that we currently have available can be made to last until winter and that the authorities may yet be able to altogether defer imposition of “Day Zero” (the imposition of the rationing/collection stage-2 of the disaster plan – read details of the three stages here). But this relies on certain things happening (some of which are already taking place) between now and then; we have to make it possible.
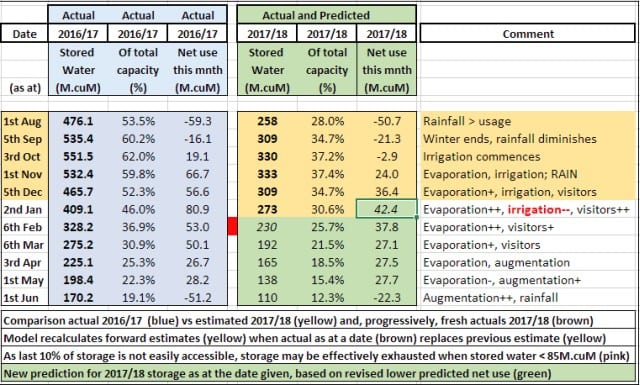
Here is my running prediction of likely water consumption and the outcome in terms of water availability. The red block shows where we would have run out of water on 6th February if we had carried on using water at the same rate as we did last summer (where restrictions were already in place). Clearly some dramatic improvement has been achieved, and I explain this below.
What actually is going on?
Since Spring 2017 I have been of the opinion that the available water stored in the dams had to be made to last through to winter 2018 and that augmentation efforts would not make enough of a difference in time. I proposed certain cuts in allocation to agriculture, business and homes that would have enabled this to be achieved. These have now all been implemented though, regrettably, somewhat late thereby limiting the potential positive impact. Nevertheless I stick by my guns – as long as all sectors adhere to the lower allocations, the water should last to June 2018.
This appears to place me at variance with dates issued by CoCT, and many readers have asked me to explain why. To do so I have used a somewhat butchered copy of the Weekly Dam Drawdown Tracker diagram created by WCWSS and published by CoCT. I reconcile my position as follows.

You asked for it so please be patient :-).
Starting from the 37.5% total storage at beginning November, the business-as-usual consumption expectation indicated a sharply descending fall in dam levels, line “A”, originally predicting Day Zero as being during week of 13th February 2018 when total storage dropped to the 13.5% level set by CoCT; that point when they would move to stage 2 of the disaster plan.
Then in November 2017 we enjoyed unseasonal rain in the catchments that lifted dam levels and effectively moved the predicted Day Zero out by two weeks to the last week February (line “B”).
My information at that time was that the so-called 10% of ‘inaccessible water’ in the dams was in no ways definite and that if necessary, given some extra filtration, more of that last ‘dead water’ could be accessed. In fact, the dams could be drawn down to virtually zero but not easily in all cases. So I assumed that they would be pulled down to, say, 7.5% (line “D”) thereby making more available for consumption. That in turn allowed a corresponding drop in the Day Zero level from 13.5% to 11% of capacity (line “C”) while still retaining the same stage-2 reserve of 3.5% of capacity. This pushed the point where line “B” intersects line “C” out into March. [In the meantime DWS has announced that they are preparing to pull both Voelvlei and Theewaterskloof dams down to zero if necessary. That would make yet more water available.]
The next major change in November was when DWS imposed new limits and cut agricultural water allocations to just 40% of normal. The effect of this massive reduction in overall water consumption is reflected by the blue-striped zone, labelled “E”; the front edge of which is where the actual consumption (denoted by the hard black line with dots in it) now lies. CoCT then simply extends it by a straight line (which assumes unchanging weekly consumption), i.e. the dashed black line which give the theoretical Day Zero date of around 22 April 2018, where that dashed line intersects the disaster stage-2 line (red “X”); by then dam levels would have dropped to 13.5% of capacity. Unfortunately this line weaves around with small changes in consumption, and in turn moves the possible “Day Zero” date around. But we already know, more water will be available from the dams, so that dashed line should extend to at least a point out in early May (point “F”).
Although they have been drawing their water allocation fast, in fact agriculture is rapidly reaching the 40% limit and projections are that half of the irrigation will be cut off by end-January with most of the rest reaching the limit and closing by end-February. The net effect should be that the agricultural sacrifice should extend the communally available water supply out to early June (point “G”). At that stage agriculture’s contribution will be exhausted and “Day Zero” will have arrived for all farms.
Now, although rain should start by June this is still far too tight and the business and household users in the metro and municipalities must save stringently and also meet their reduced allocations. At the moment the CoCT is still running at about 586ML/d. It simply must not only immediately get down to the current target of 520 ML/d – which will add two weeks of available water – and from 1st February further reduce to the 50L/p/d – which would result in another two weeks water saved. In total the residents now have to cut usage in order to save that blue zone labelled “H”. This action would make all the difference and defer Day Zero to around 1st week in July (point “I”). As I showed last week, with average consumption probably still up in the area of 110L/p/d every effort must be made to encourage that half of the population that is still using way too much water to stop doing so (hopefully the new harsh tariffs will help).
If we do reach July, then nature should start to help with winter rains and low evaporation commencing perhaps late-May, but surely in June (yellow zone “J”).
Last but not least, the various augmentation initiatives should be starting to make steadily growing contributions (brown striped zone “K”) and, in the final analysis (as I envisage it) ‘our spaceship Cape Town should just skim past the sun’ and the immediate danger should be passed (dare I say it that Helen Zille’s “just squeak through” scenario and mine are now in close agreement) and hopefully the total available water will recover along the heavy dotted red line, labelled “L”.
In summary, this outcome depends clearly on three main things:
1) the dams must be drawn down at least into the range of 6% – 7.5% of capacity; this will be done!
2) agriculture is exhausted, so businesses & households must now reduce consumption to 50L/p/d.
3) at least normal rains needs to arrive to start recharging the dams from July onward.
If rains once more fail and Day Zero arrives, then we will at least know we have done our best!
What are the authorities doing now?
Public opinion prevailed and the metro abandoned plans for a “drought charge” based on property values in favour of a more equitable system of applying tariffs based on water consumption and punishing harshly those who continue to waste water. Fairly, this calls for reduced target consumption to 50L/p/d under level-6b, to be implemented from 1st February, 2018. This was our collective decision so this initiative now deserves our fullest support.
There has been a change in political management with deputy mayor Ian Nielsen, an civil engineer with decades of water engineering experience, now in control of the water team and its response in Cape Town.
The Premier and her team have stepped in and Province is engaging various sections of central government pursuant to obtaining maximum support for SW Cape (from DWS, Police, Disaster Management, Military, Security) and seeking commitments of assistance should Day Zero happen.
City of Cape Town reported that the amount of water it drew from the dams fell to an average of 586 ML/day (from 598 ML/day) while the water used from ‘all sources’ eased to 608 ML/day. As can be quickly seen, the difference grew from 20ML/d to 22ML/d, indicating a small but important growth of water being generated by augmentation efforts. This is an important indicator of growing success.
According to Trevor Balzer, Deputy director general of the water and Sanitation Department, plans are in place to try and extract the last 10% of the water from Theewaterskloof and Voelvlei dams. Work is already under way at Voelvlei. But as I cautioned last week, this requires great care because it has been found that below a certain critical level, the temperature of the increasingly stagnant water rises, promoting algae growth causing fish to die and rot. Consequently the last of the water can thereby become toxic and unusable. This action is welcomed by Dr Kevin Winter of UCT, “It makes sense to squeeze out as much as possible,” he says. “The water situation is so uncertain at the moment. Yes, it’s not looking good at all, but a lot can happen in 90 days.”
See details of Cape Town’s planned interventions to produce fresh water here.
Learn about water savings efforts by other Cape municipalities – read more here.
Do visit the City of Cape Town website to see additional graphically presented information regarding the water situation – very helpful.
1) See the full water status presentation here and
2) Check out water usage for your property and of neighbours, friends, using this interactive map.
What ought you be doing?
1) Beware of misinformation, and worse, disinformation (“fake news”) and make sure that you are accurately informed. Join a reputable social media group like ‘Water Shedding Western Cape.
2) Try not to get worked up over deliberately incendiary political comments on social media. Much of it is uninformed clap-trap. Ignore it and don’t get agitated. No one, but no one is trying to make this potential catastrophe happen and many, many skilled people are doing all they can to help avoid disaster. Trust that fact. If you want to understand the underlying politics contact your local councillor and ask for an update. Ignore the rumours. Be clear that no one will be favoured in the resolution of this situation and all would suffer the inconvenience of Day Zero should it arrive. Also, be reassured that no part of the metro is connected to any specific dam – the water from any dam can reach any part of the municipality and suburbs.
3) To obtain good information and advice, search the Water Shedding Western Cape FB group page for different themes (eg storing and caring for water) and read up on suggestions. Get your thinking sorted out on how you can best save water and what to do to prepare for possible problems. At least invest in some drums or tanks and start saving rain water so that you have some personal water independence – there will be plenty of rain still across the metro before winter arrives.
4) There is no need to wildly start buying supplies now but do draw up some contingency lists and then do some window-shopping, checking availability of items and prices, and set aside some ready cash. If the situation does deteriorate then perhaps start laying in extra supplies during April. Get your insurances, IDs and municipal accounts in order.
5) Chat to your neighbours in your street and start a local WhatsApp group [I suggest call the group “Water Warriors – xyz Street” that will be easily remembered and others possibly looking for you will will be able to easily find your group and get in contact. Keep each other informed on local issues and plan to help elderly or infirm folks.
6) Beware of renegade plumbers offering to bypass meters. This would not only be anti-social but also a crime and open you to prosecution.
Will the weather help?
As forecast, there was some scattered light rain over the past day or so and some more light rain in the catchments is forecast over the coming 24 hours. But after that the weather will remain sunny and hot through until March where some spells of occasional rain are predicted.
What seems actually to be going on with the SW Cape climate?
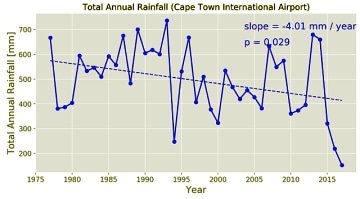
Oliver Angélil, a Phd student at NSW university, Australia has made a study of the Cape Town Weather patterns which shows up some important climate trends. This chart shows a worrying rainfall trend (as stock market folks say, a chart with falling lows and falling highs indicates a very clear downward trend). See more of Oliver’s intriguing charts here.
Here is the rainfall chart for the dam catchments for the period since 1st April 2017.

In Summary: outflows exceeded inflows by 12.7 M.cuM and combined dam levels fell to 26.9%.
Here are the levels of the six main dams serving the Cape Town/Overberg/Boland area. As may be seen from this table, the four mountain dams still hold more water than they did this time last year.

Here are some of our thoughts of possible implications of “Day Zero”.
Plan ahead for possible water outages; here are points that could help.
Read our Indoors Water Savings Ideas here.
Read our Outdoors Water Savings Ideas here
Read about a D-i-Y household rainwater harvesting and tank system here
Read about South Africa’s desalination policies and initiatives.
Click here to see Winelands Weather forecast of possible near-term rain.
Report instances of piping failures and incorrect use to municipalities.
In Cape Town the contact details of the 24-hour Technical Operation Centre are: Email: waterTOC@capetown.gov.za Telephone: 0860103089 (choose option2: water-related faults) or SMS: 31373 (max 160 characters).
Tom Brown.
Views expressed in this article, and comments in response, are those of the writer and commenters alone and do not necessarily reflect the views and opinions of ShowMe, nor is any warranty hereby given as to suitability for any purpose of a reviewed enterprise or as to the quality of offered advice, products, services or value. Copyright ShowMe Paarl. All rights reserved. Copy only with prior permission.
Related Articles


3 Comments
You must be logged in to post a comment.


curious
Just curious as to what will be the effect of people using ground water (borehole) excessively and dropping the ground water levels to top up swimming pools and tanks. This must surely have an effect on the eventual recovery of already dry rivers being able to flow into dams, to fill dams and provide water to residents. Has this recovery lag been investigated?
Your reply and comments welcome on this matter.
tombrown
Hi Trevor.
It may have a small effect but I think that the volumes at this time are tiny compared to the size of the aquifer.
However, this situation will surely gradually worsen and it is for this reason that DWS has legislated that all users of wells and boreholes must fit tracking devices and to report the amount of water abstracted weekly.
Regards, Tom.
prd1923
Tom,
Thank you for once again for the clarity of the numbers and focusing on the real options we have in front of us. Much appreciated.
Peter