


Dams – Latest levels: Winelands and Cape Town
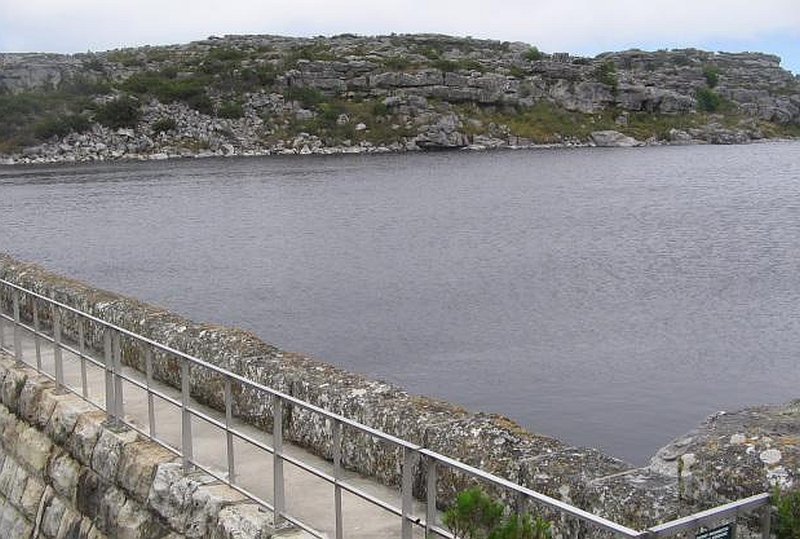 (Alexander Dam, Table Mountain, Photo: DWS)
Latest report (updated 20th November 2017) on the main dams serving
Cape Town City and nearby Boland/Overberg towns
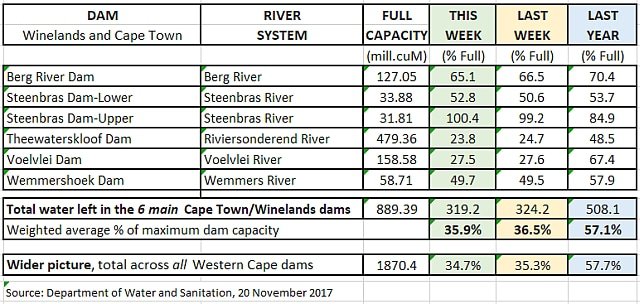
A wetter week saw outflows exceeding inflows by just 5.0 M.cuM, 0.6% of capacity of the 6 main dams (vs 8.7 M.cuM net outflow last week).
As a result, combined dam levels dropped to 35.9% of capacity. During the same (far drier) period in 2016, total dam levels declined by 1.6% to 57.1% of full capacity.
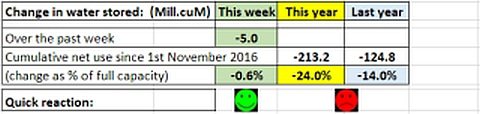 In the process the cum. difference in the net use closed up to 88.4 M.cuM when compared to last year.
Current status?
Water stored in the 6 main dams dropped to 319.20 M.cuM (234 M.cuM of easily accessible) (last year this dropped to 508 and 423 M.cuM respectively over the same period). Unseasonable rainfall during November to date has resulted in a smaller than expected fall in dam levels.
Note: The 10% that is conventionally used to estimate the amount of water in the dams that may be harder to abstract is always calculated on the total combined capacity, i.e. 895 M.cuM, and not on the water remaining in the dams at any one time. Anyway, the 10% is notional and very unscientific, so in my calculations I use a round 85 McuM as being generally inaccessible in order to be comparable with the statements issued by other instances.
However, final inaccessible portion actually varies dam to dam depending upon:
- Height of abstraction point above lowest point in the dam,
- Nature of dam bottom (e.g. silty vs rocky, shallow/flat vs steep),
- Contains rare biosphere that needs to be protected or not.
It appears that most dams can in fact be drawn down to 6% or less and, if the abstraction point is low and the bottom is rocky/unsilted, maybe even until a dam is completely empty. On the other hand, muddy/silted dams are more challenging as their dirty last waters can over-burden the water treatment plants and require extra filtration. So, for example, DWS has the material ready to build a berm at the road bridge in Theewaters dam to enable them to pump water up from the deeper section of the dam to where the (higher) abstraction point can take the water over to the Berg River system.
If DWS could, on average, go down to, say, 5% of all dam capacities then that could make about 45 M.cuM more water available than conventional wisdom assumes, and extend supply accordingly.
If you look at my chart of days water available (below) you will see that I already factor this in (green columns) to the estimated water available calculation.
How long will the remaining fresh water last?
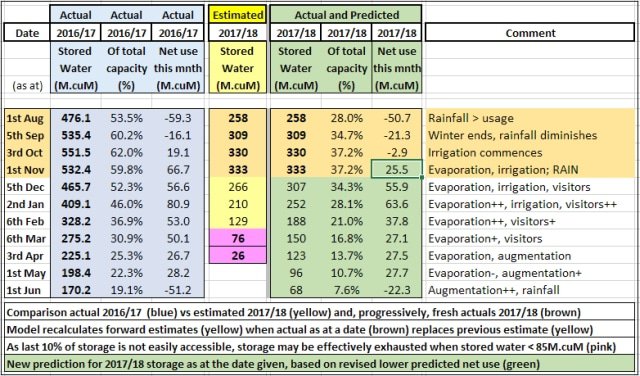
In our model the baseline calculation of water remaining at the start of each month is shown in the yellow column. This assumes that the same rainfall and consumption levels will happen in 2017/18 as took place in 2016/17 (blue columns) under the level 3 restrictions that applied at that time.
Using the actual of 333 M.cuM that remained at the start of November 2017, and assuming “business as usual” in terms of rainfall and usage from the previous summer, then it was estimated that the theoretical “zero water day” (pink) where combined levels of the dams could fall below the 85 M.cuM minimum would occur around first week of March, 2018.
However, the reality is changing quite fast for various reasons and so I have added the predicted situation in the green columns.
We await gazetting by DWS of new restrictions for all Cape users that should target to reduce consumption further and to ‘stretch’ current supplies of water out to last until next winter.
I use projected changes to allocations when calculating what the then resultant amount of stored water could be (green columns) each month.
Furthermore, as November has turned out to be even better than my revised estimate, I have applied a mid-month correction reducing the anticipated net usage in November from 45 M.cuM to 25 M.cuM to comprehend the extra rainfall run-off being experienced. The model, therefore, now predicts that the November month-ending volume of stored water could be as high as 309 M.cuM, indicating clearly that at the anticipated reduced levels of usage, the currently available water stored in the main dams could last through into June, 2018.
Mayor De Lille recently revised her estimate of the “Day Zero”date out from March to 13th May. She’s getting closer.
What are the authorities doing now?
Read here about all the extra water production projects planned by the City of Cape Town.
What has already been achieved? To date the City has announced that the following projects have been initiated.
- Atlantis Aquifer abstraction improvements, already contributing 5 ML/d from November 2017
- Orangezicht Springs leading 2 ML/d to the Molteno reservoir from November 2017
- V&A de-salination plant under construction, intended to contribute 2 ML/d from February 2018
- Monwabisis and Strandfontein desal. plant scontracted to produce 8 ML/d from April 2018
- Refitting the Zandvliet water treatment plant to reclaim waste water is under way. No target yields or dates have been released, but Zandvliet and Fisantekraal treatment plants are expected to each produce 10ML/day of reclaimed water.
- In the Steenbras catchment area CoCT has commenced drilling into the TMGA aquifers to increase water supply by approximately 10 million litres a day at this site, with yield progressively climbing after February 2018.
- Building contractors are being urged by the City to use reclaimed water for all non-sensitive construction work, such as dust suppression, cleaning, etc (potable water is still required for mixing cement). Reclaimed water can be piped to some areas and trucked to others. Reclaimed water costs less that R5.50/KL.
- Alien vegetation is being cleared in the catchments. At Wemmershoek, 50Ha of pines have already been felled and another 110 Ha will be cleared over the coming 12 months. This action is expected to save on average over 1 ML/day.
In anticipation of “Day Zero” arriving, Cape Town City has built and is testing a water collection point. Andrew Sokolic summarises the program as follows: When Day Zero arrives, Cape Town’s residents will have to collect water from centres like this.
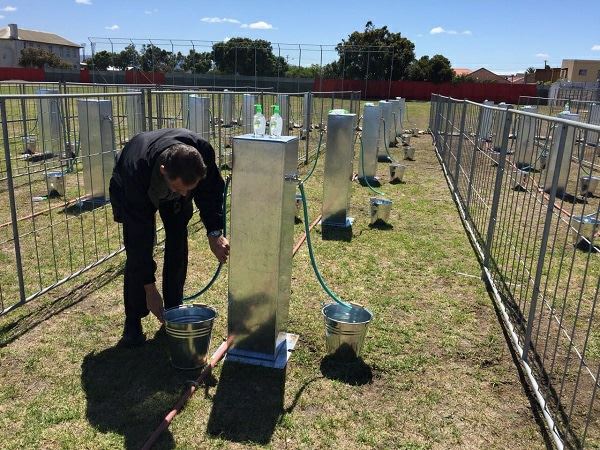
- There will be approximately 200 sites collection sites across the city.
- Residents will be able to collect 25 litres per person per day
- Each site is expected to service up to 20 000 people per day
- The City’s Water and Sanitation Department will try to limit the impact on sanitation services to limit the risk of disease
- SAPS and the National Defence Force are being consulted to help maintain law and order with Law Enforcement at collection points
Other indirect and direct structural threats to the overall situation are:
- Possible increase in the cost of electricity of between 19.9-25% should the current proposals by Eskom be approved. This would obviously increase the cost of all augmentation measures being undertaken as they all tend to be energy-hungry.
- Agricultural production forecasts are being reduced and producer prices of some fruits have already climbed by 12-15%. Costs of vegetables may escalate similarly.
- In 2018, new minimum wage structures come into effect which will cause a 20%+ increase in many labour costs.
All industries will be affected, but the sector that will be heavily impacted is agriculture. Given that the cost of fuel and chemicals have already been rising steadily, the newly proposed increase in electricity costs together with the already gazetted increase in basic wages will drive overall costs of production up sharply. Against this background, the decease in available irrigation water by as much as 60% will reduce crop revenues to the extent that many farms could start to fail.
The net effect of such falling agricultural production and related initiatives needed to reduce costs will inevitably lead to the loss of both permanent and seasonal jobs in this important sector. The outcome is likely to be a potential move of families from rural locations into towns and cities, thereby adding to the already over-burdened employment market and social services.
When such disruption combines with likely already rising unemployment in city-based industries, a fairly toxic situation could develop.
What ought households to be doing?
The debate is starting to intensify. As more information about the authorities’ planning for possible “Day Zero” disseminates, questions are being asked.
Kathy F. reasonably asks: about this “Day Zero” scenario & having to collect water at points.
1. How does a single mum with 2 small kids who works full time go & collect 75l of water?
2. Will CoCT put laws into place to prevent companies from penalising employees who have to take time off each day to collect water?
3. How are the elderly or disabled going to manage to collect their ration?
4. How many of us can actually carry 25l of water?
5. Then we come to the containers. Will CoCT provide us with 25l containers? Will they be free, or will we be charged?
6. Old age homes & the like – how will they get water. I was told a water truck will deliver. Where on earth will they store the water? Many won’t be able to afford tanks. Will CoCT provide tanks for them?
Germaine S. wisely comments as follows:
To calm the panic and fear that people are feeling right now I suggest we all start forming water committees in our streets and neighbourhoods.
1. Have meetings to discuss strategies and plans for water collection should it happen.
2. Do an audit of who has water in the street and a plan for how you will all protect it if you have to.
3. Do another audit of how many elderly / disabled are in your road so that no one is left stranded
4. Do an audit of equipment/ vehicles that might be useful
5. Discuss whether the road could club together to invest in air to water technology
Worst case scenario… you get to know your neighbours better and strengthen the resilience of your road.
Dani N adds: start a (small) community WhatsApp group – i.e. your block / your street
Take steps to ensure that you are regularly and accurately informed.
Here are some of our thoughts of possible implications of “Day Zero”.
Generally plan ahead for possible water outages; here are points that could help.
Will the weather help?

Good rain is expected across the SW Cape over the coming two days. A moderate cold front has bullied its way past the resident South Atlantic High and should make a direct hit on the Cape around midnight tonight (Mon).
The mountain catchments should benefit; 25-30 mm is forecast in Franschhoek and Wemmershoek with 30-40 mm due in Gordon’s Bay and Jonkershoek.
This NOAA/CPC chart shows the cumulative rainfall expected over the week to 26th November.
No other significant systems are forecast with only occasional showers from time to time.
 A La Niña condition is now in effect. The Pacific Ocean temperatures are dropping steeply. This should benefit inland areas but may also nudge the South Atlantic high northwards, allowing more cold fronts to reach the Cape.
This chart tracks rainfall at the dams since April 2017. There were good rains last week but it all tended to fall east (downstream) of the dam catchments, meaning that none of the dams benefited very much. Hopefully the coming week will see better rainfalls on and around the dams.
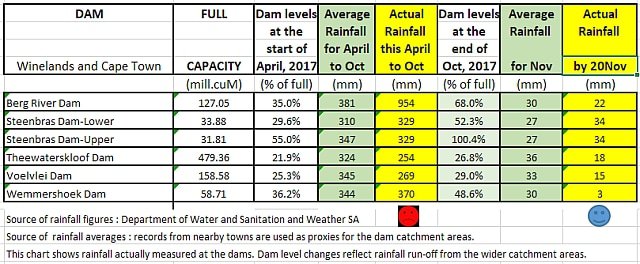
In Summary: outflows exceeded inflows by 5.0 M.cuM and combined dam levels fell to 35.9% of total capacity. Most of last week’s rain fell outside of the catchments, but the main dams should benefit from rain this week.
This table shows the levels of the six main dams that serve the Cape Town/Overberg/Boland area as reported by Dept Water and Sanitation. It seems that combined water stored ahead of summer has now peaked and an accelerating drop in dam levels may now be expected.

Read our Indoors Water Savings Ideas here.
Read our Outdoors Water Savings Ideas here
Read about a D-i-Y household rainwater harvesting and tank system here
Read about South Africa’s desalination policies and initiatives.
Click here to see Winelands Weather forecast of possible near-term rain.
Report instances of piping failures and incorrect use to municipalities.
In Cape Town the contact details of the 24-hour Technical Operation Centre are: Email: waterTOC@capetown.gov.za Telephone: 0860103089 (choose option2: water-related faults) or SMS: 31373 (max 160 characters).
Tom.
Views expressed in this article, and comments in response, are those of the writer and commenters alone and do not necessarily reflect the views and opinions of ShowMe, nor is any warranty hereby given as to suitability for any purpose of a reviewed enterprise or as to the quality of offered advice, products, services or value. Copyright ShowMe Paarl. All rights reserved. Copy only with prior permission.
Related Articles


