


Dams – Latest levels: Winelands and Cape Town
 (Kwaggaskloof Dam, photo: Brown)
Latest report (updated 30th October 2017) on the main dams serving
Cape Town City and nearby Boland/Overberg towns
October was a better month with rainfall run-off unexpectedly exceeding outflows by 9 M.cuM.
This caused combined dam levels to rise across the month by some 0.9% to 38% of full capacity. During the same period in October 2016, total dam levels declined to 60.7% of capacity.
As can be seen from the chart below of the cumulative change over the 12 months since 1st November 2016, despite all efforts to reduce consumption, outflow from the main dams exceeded inflows by almost exactly 101 M.cuM (-193.7 vs -92.9) more than in the previous 2015-2016 period. This difference is entirely due to a lack of rains over the main dam catchment areas in 2017.

[Why since 1st November 2016? that was when harsher level 3 restrictions were imposed].
Current status?
Total water in the dams lifted to 338.7 M.cuM (254 M.cuM of easily accessible) water (last year this dropped to 540 and 455 M.cuM respectively over the same period). We are now likely to be on or about the maximum combined dam levels until next winter. Although occasional rain may yet surprise, a steady drop in the dam levels may be expected from here on. The absence of rain will enable us to better judge, week by week, the net effects of the reductions in water consumption taken together with any extra water produced.
Business in SW Cape is now starting to feel the effects of the water shortage, with 49% of concerns in the area reporting that the drought is threatening their survival. It is estimated that at least 50,000+ local jobs are now under threat.
How long will the remaining fresh water last?
Here is our progressive estimate for 2017 compared with what actually happened in 2016. It predicts consumption across the coming 2017 summer season (yellow) by assuming that the same rainfall and consumption patterns will prevail as happened last year (blue). Actual results will, of course, surely deviate from this theoretical outcome.
When the model recalculates with the actual end-October combined dam contents, it will then show that the theoretical “zero water day” (pink) will have moved out to first week of March, 2018.

However, many factors in the calculations are now starting to change and the patterns of the 2017-18 summer season will probably differ substantially from actuals of previous years.
As I have written before, the only safe way of dealing with this situation is to reduce overall consumption to the point that we can survive until next winter with only the water that we presently have stored in the dams. If unseasonal rains then arrive and/or the authorities’ water production interventions start operating as planned and producing extra water as hoped, we will start to develop a safety margin that will help if the 2018 winter also dissapoints.
So, based on investigations and a careful recalculation of water consumption factors under the new revised allocations that I understand are being applied, I have introduced in the chart a new prediction of probable total usage together with a prediction of what the resultant amount of stored water will be (green columns). What this shows is that with planned reduced consumption, the available stored water would see us through to June, 2018.
This hinges primarily on two things:
- that the water consumption by the municipalities drops to the level equivalent to that achieved by Cape Town (i.e around 48% reduction) including commerce, industry and the tourism sectors;
- and that a similar 50% reduction is made to agricultural irrigation allocations (the reason that there is such a sharp fall-off in predicted use from February is that irrigators will tend to take all their water allocation up front; i.e. they will tend to draw at the full rate through until January and then their supply will be cut off until the next winter. therefore, unlike previous years there should be very little irrigation water consumption after January 2018).
Unfortunately, evaporation cannot be scaled and will still tend to stand at historical levels, becoming proportionately higher as all other categories of consumption reduce.
It seems that with careful abstraction methods and more suitable filtration at the water treatment plants, the dams can probably all be drawn down to around 6% of capacity (rather than the generally accepted 10%) before the biospheres start to suffer major damage. In the case of TWK Dam it will require the completion of a coffer dam with additional pumps to enable water to be lifted to the point where it can be transferred to the Berg River side.
Augmentation of water through the interventions by the various municipalities should start to contribute additional fresh water from March onward.
The net end result is that the SW Cape area could get through the coming dry summer ending up with the combined storage in the dams reaching the lowest attainable level around 54 M.cuM just as the 2018 winter rains commence and new water production should be coming fully on line.
What are the authorities doing now?
It is important to maintain perspective on the bigger issues and to be clear on what has actually taken place over the past years regarding water supply to the SW Cape.
Bulk water supply and storage is the responsibility of central government. From this bulk supply, water is then allocated and supplied to other users (e.g. agriculture) while the municipalities are responsible only for water treatment, distribution and waste management. It is absolutely wrong to blame the council of any single municipality (e.g. Paarl, Stellenbosch, Saldanha, Cape Town or wherever) as being solely responsible for the water shortage in SW Cape Dams.
If you have not already done so, please read the “FAQ’s and Honest Answers” from Helen Zille in the interview published here in the Daily Maverick.
City of Cape Town has published its disaster management plan which has three stages (the first stage that we are now in involves extremely reduced pressure (throttling) and in some cases water outages (rationing).
The City is proceeding with interventions to produce additional fresh water (read the excellent explanatory article about these technologies by Dr Anthony Turton here).
One thing that had held up matters was permission from Treasury for the City to deviate from its agreed budget in order to assemble sufficient cash to fund the extra expense of these interventions. This permission was finally granted yesterday (30th) by Finance Minister Gigaba. Implementation of the plans to produce extra water should now accelerate.
This chart published by CoCT on 19thOct. gives an outline of the specific interventions planned.
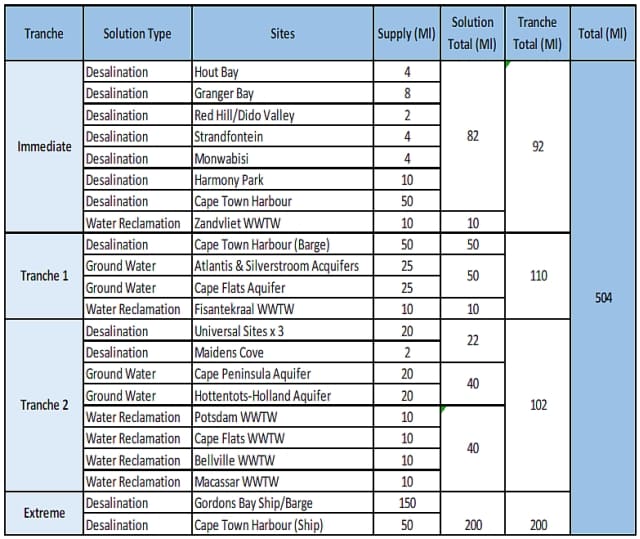
It appears that CoCT is now proceeding as fast as possible with “Immediate” and “Tranche-1” items. These aim to produce 150+ML/day somewhere between Feb and May 2018. Three days ago Mayor Patricia De Lille announced commencement of the construction of a 2ML/d desalination plant within the V&A waterfront area.
Water allocations to agriculture in SW Cape are now reduced by 50%. This may be further reduced after the DWS modelling exercise which will take place this week. The supply approach for farms is different to households in that they are not gradually rationed but rather receive water until their reduced allocation is all used up and then the water is just cut off completely until next season.
What ought households to be doing?
The City of Cape Town has issued guidelines as to how best to deal with the reduced water supply and rationing – read it here and prepare your household accordingly.
Here are points that we believe are important when you plan ahead for possible water outages.
The likelihood is high that the authorities may shortly announce another cut in household water consumption targets once finally revised allocations for the different users are set after the DWS modelling exercise.
Will the weather help?
October rainfall was better than expected. The Berg River, Steenbras and Wemmershoek dams benefited most from the rains last week. In fact the two Steenbras dams are now collectively slightly fuller than they were at the same time last year.
November is forecast to see occasional rain every week and, while it will generally be light, it may well be accompanied by thunderstorms from time to time – if you are lucky enough to be under one you should experience good rain. The main event could be a cut-off low that may develop around 3rd November and bring rains down from the NNW to the SW Cape interior.
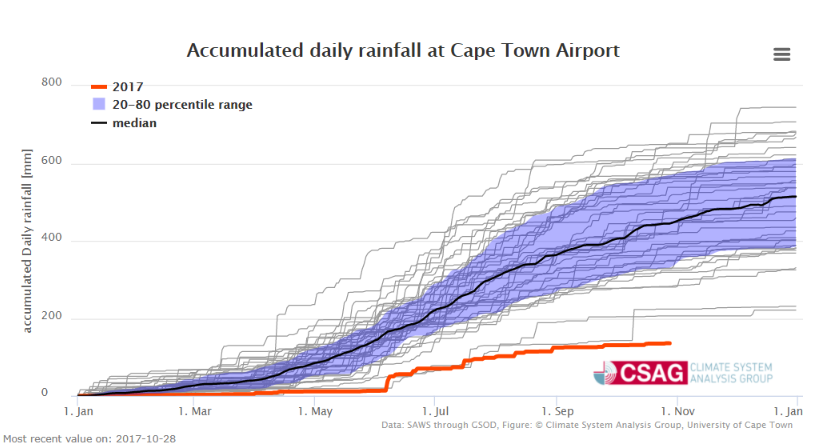
The chart below by UCT shows that 2017 rainfall at CT airport is now the lowest in 40 years.
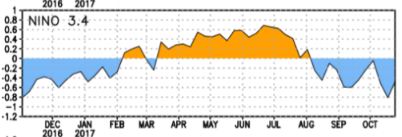
Pacific Ocean temperatures are now down in La Niña range, expected to endure through the southern summer. This will bring heavier rains to the interior, some of which may spill over in the form of cut-off lows over the Western Cape.
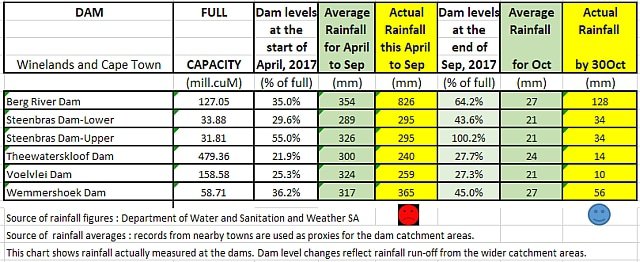
Here is the rainfall experienced at the dams for the period since 2017 winter began. October 2017 was markedly better than October 2016 but still below average for the big Theewaters and Voelvlei dams. Berg River Dam, Steenbras Dams and Wemmershoek Dam continue to do well.
In Summary: the dams experienced slight outflow of 1.0 M.cuM this past week dropping the combined levels to 38.1% of total capacity. Rainfall run-off in the mountain catchments is still largely balancing outflows.
This table shows the levels of the six main dams that serve the Cape Town/Overberg/Boland area as reported by Dept Water and Sanitation. It seems that we may be approaching the peak level of combined water stored ahead of summer. The state of other dams across the Western Cape also remained unchanged.


Read our Indoors Water Savings Ideas here.
Read our Outdoors Water Savings Ideas here
Read about a D-i-Y household rainwater harvesting and tank system here
Read about South Africa’s desalination policies and initiatives.
Click here to see Winelands Weather forecast of possible near-term rain.
Report instances of piping failures and incorrect use to municipalities.
In Cape Town the contact details of the 24-hour Technical Operation Centre are: Email: waterTOC@capetown.gov.za Telephone: 0860103089 (choose option2: water-related faults) or SMS: 31373 (max 160 characters).
Tom.
Views expressed in this article, and comments in response, are those of the writer and commenters alone and do not necessarily reflect the views and opinions of ShowMe, nor is any warranty hereby given as to suitability for any purpose of a reviewed enterprise or as to the quality of offered advice, products, services or value. Copyright ShowMe Paarl. All rights reserved. Copy only with prior permission.
Related Articles


