


Dams – Latest levels: Winelands and Cape Town
 (Voelvlei Dam, 25% full, DWS photo)
Latest report (updated 28th August 2017) on the main dams serving
Cape Town City and nearby Boland/Overberg towns
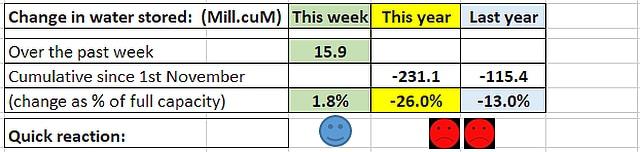
A better week – more rains flowed into all the dams resulting in combined water stored rising by 15.9 M.cuM (1.8% of capacity) vs 12.5 M.cuM (1.4% capacity) the previous week. Total stored water rose to 33.9% of full capacity.
During this week last year the dams rose by a smaller 11.4 M.cuM to reach 58.2% of capacity. So we did relatively better than during the same period in 2016.
[Why since 1st November 2016? that was when level 3 restrictions were imposed].
Current status?
There is now 301 M.cuM (216 M.cuM of easily accessible) water in the dams (last year same time this stood at 518 and 433 M.cuM respectively).
The UCT Climate Systems Analysis Group chart (as at 26th August) shows cumulative rainfall year-to-date (red line) (measured at CT Airport). It is obviously way, way below the averages of the past 12 years. This week I have also highlighted 2016 (pink line) which shows that last year there was a substantial burst of rain in August which has failed to arrive this year. No such heavy rain is predicted over the coming weeks.

How long will the water last?
The new table below gives a side-by-side comparison of the situation this year compared to what actually happened in 2016 (In 2016, the better starting level together with stronger rains and restrictions enabled the dams to reach that safe level of 55% of capacity, which saw us through to this winter.
Why do it this way? Because it enables us to fairly judge status after the impact of any interventions and/or further restrictions by tracking net off-take from the dams. In other words, while allowing for the effect of “normal” on-going restrictions and occasional rain, this method will also show any beneficial outcome from interventions actually implemented by the City (for Cape Town) and DWS (for other towns and agriculture in SW Cape) over the coming months.
So, rather than having to depend upon pronouncements from authorities, one will be able to see improvements which would take the form of relatively reduced withdrawal of water from the dams when compared with the figures for 2016, i.e. before any interventions were made. That should cut out any false news, exaggeration or inaccuracies – either we will see an improvement or we won’t; no guessing needed.
In the table, blue shows 2016/2017 actuals; yellow shows estimates of available water assuming the same pattern as last year; while brown will progressively record matching actuals for 2017/18.
As at this report date of 28th August we stood at 301 M.cuM, on course to reach the predicted level of 317 M.cuM by month-end. If we do, that will tell us that the combined effect of level 4b restricted consumption and rainfall received in the catchments netted out much the same as it did during the same month in 2016 (it is too early for any interventions to skew the figures).
If it does reach 317 M.cuM or thereabouts by month-end, the model will continue to predict that – given the same broad net usage patterns as last year – accessible water would be exhausted by around mid-February 2018 [somewhat in contradiction of Mayor De Lille’s recent assertion that the City could run out of water by December].

As we draw to the end of the normal winter rainfall period the situation becomes increasingly stark: it is less and less likely that nature can help much more so we will be increasingly on our own.
The solution will be left in our collective hands! In reality only two avenues will remain open:
- reduce consumption still further to stretch out existing supplies.
- urgently implement affordable, practical methods to “produce” more potable water.
So there is no point in wasting time on the “blame game”; the simple truths are that
- the weather has departed substantially from past patterns and that far less rain has fallen in the three past winters than has been the case on average over time.
- in fairness, the authorities can be understood for having hoped that some normalisation of rainfall would have occurred this winter – that it hasn’t done so marks a major departure from recorded past weather patterns.
- CoCT authorities have announced actions to “produce” additional potable water [see below] within the constraints of what is affordable and practically possible over the 6 or so months that remain before water reserves are depleted.
- WC government will need to intervene to ensure that a further sharp reduction in water consumption takes place across the entire SW Cape (whole area served by the main dams).
- DWS is cutting back irrigation water delivered to agriculture.
Against this background, it is so important to accept that the only truly dependable “given” at the moment is the level of water that is actually stored in the dams; all else is speculative and may not come to pass.
Therefore, in my opinion, the authorities should act now to take all necessary steps to ensure that the available water will last until next winter (read here thoughts on how to ensure sufficient potable water is available until winter of 2018). There simply is no choice – we really need to take steps to make sure that we can survive with what water we now have left. Nothing else can be absolutely relied upon. And if interventions or unexpected rains do later provide relief, one can always ease up on restrictions.
If we do not save water now, while we still have it, we risk that the dams will indeed run dry.
Furthermore, as Andrew Sokolic recently pondered; what happens if next winter is also dry? When one considers the prevailing drought in southern Europe (a matching Mediterranean climate zone) water shortages in cities like Rome, wild fires in France, unprecedented floods in Houston, droughts in parts of India and China, it seems to become clear that global weather patterns have entered an unusual phase. Whether it is an early onset of climate change or just isolated local phenomena is possibly too early to say. But we certainly can see that the changed weather pattern in our part of the world requires very careful adjustment in the water production, storage and management strategy.
What ought households to be doing?
I make no apology for repeating, make your household more water-resilient by using far less water (read my suggestions) and install some means to harvest and store water under your direct control. Use the UCT Climate Groups model here to estimate correct tank sizes for your situation.
I am hugely encouraged by what so many people have done and are doing to install rainwater capture and storage systems. It is never too late to start. Some rain falls every month across the Cape and whatever you can capture will reduce your draw on the municipal system while giving your household more options as to what it does with its water. Furthermore it will save you money and, in time, could become important to survival. If you need ideas, do visit the Facebook Group ‘Water Shedding Western Cape’ and scroll through to read about what so many have done to implement household-level water capture and storage.
What are the authorities doing now?
City of Cape Town has announced specific interventions to “produce” more potable water to avoid the City running out of water (read the full announcement here), aiming to produce 500ML of water per day, to withstand future droughts and possible water shortages.
This is what is planned.
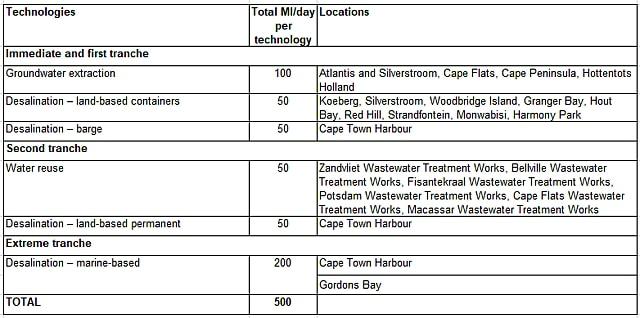
We are informed that tenders are in the process of being issued and little new information may be expected until these are adjudicated and awarded. The possibility of such interventions making a positive contribution will then depend upon how fast they may be implemented and brought into production by the contractors.
Hiring of one or more ship-mounted desalination systems (each capable of 50ML of water per day) is likely to be the most manageable and hopefully most quickly implemented resource.
But, as one astute reader of this report remarked last week, the “brutal truth” remains that even installation of fresh water production of 150ML/day by end-December, will perhaps only delay by a few weeks the point where water in the dams may be depleted.
We now need to be patient for the tender process to run its course before CT City Council can issue an accurate projection of what fresh water production may depended upon.
A small amount of R20.8m has been granted by central government to assist the City to deal with its fresh water challenges.
Will the weather help?

As I write rain has been falling, with some some 5-10 mm of that dropping in the dam catchments, which should help to keep the feeder rivers flowing.
However, once more the dominant high pressure systems have forced the main body of the system well south of the land, as shown by this synoptic chart from SA Weather Services.

After that the medium range forecasts from NOAA/CPC indicate only occasional rain until around 3rd week September when a last burst of 25-40 mm of winter rain is expected to extend across all the dam catchments.
 Possible emergence of the colder La Niña condition could introduce late season unstable weather and rains, although it is probably too late for the SW Cape and may only benefit inland areas as it did in 2016.
The chart below shows the rain that has actually fallen in the dam catchment areas since the winter began. Except for Theewaters, all the dams received useful rain run-off last week. Theewaters is receiving water pumped across from Berg River Dam. Similarly Upper Steenbras Dam is now full and is spilling into Lower Steenbras Dam. The Berg River and Wemmershoek dams continued to be the main recipients of the recent rains in the mountains.

In Summary: fresh rains caused net inflows of a good 15.9 M.cuM lifting dams levels up from 32.1% to 33.9% of total capacity. But dam levels are still very low; on-going water savings are essential.
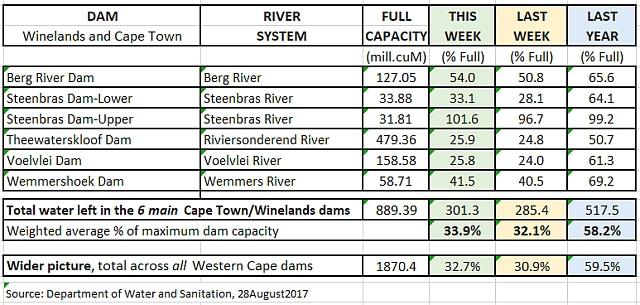
This table shows the levels of the six main dams that serve the Cape Town/Overberg/Boland area as reported by Dept Water and Sanitation. It also shows total water storage levels of all dams in the greater Western Cape area.

Read our Indoors Water Savings Ideas here.
Read our outdoors Water Savings Ideas here
Read about a D-i-Y household rainwater harvesting and tank system here
Read about South Africa’s desalination policies and initiatives.
Click here to see Winelands Weather forecast of possible near-term rain.
Report instances of piping failures and incorrect use to municipalities.
In Cape Town the contact details of the 24-hour Technical Operation Centre are: Email: waterTOC@capetown.gov.za Telephone: 0860103089 (choose option2: water-related faults) or SMS: 31373 (max 160 characters).
Tom.
Views expressed in this article, and comments in response, are those of the writer and commenters alone and do not necessarily reflect the views and opinions of ShowMe, nor is any warranty hereby given as to suitability for any purpose of a reviewed enterprise or as to the quality of offered advice, products, services or value. Copyright ShowMe Paarl. All rights reserved. Copy only with prior permission.
Related Articles


