


Dams – Latest levels: Winelands and Cape Town
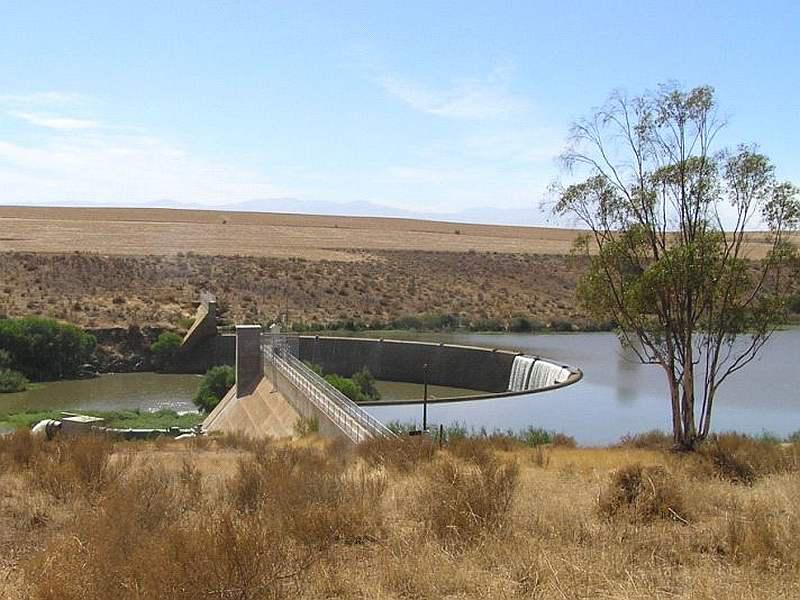 (Misverstand Dam, Lower Berg River, DWS photo)
Latest report (updated 24th July 2017) on the main dams serving
Cape Town City and nearby Boland/Overberg towns
Net inflows to the main dams increased and total water stored rose by a similar 8.3 M.cuM (0.9% of capacity) to stand at 27.0% of capacity. Last year the dams levels stayed level during the same week due to an absence of rain at that time.
Our year-on-year comparison table below shows that the gap between net water used this year compared to that used in 2016 closed up a bit due to the difference in rainfall experienced last week. The alarm continues to ring however – as can be seen, despite the greater savings this year, we have in 2017 netto consumed 56.6 M.cuM of water more than in the same period of 2016. This is equivalent to having additionally completely emptied a dam of the size of Wemmershoek.
The reason is, of course, less rain in the catchments this year than last year. The problem is that we now need torrential rain to recharge the dams; and there is none of that on the horizon.
 [Why since 1st November? that was when level 4 restrictions were imposed].
There is now a total of 240 M.cuM (155 M.cuM of easily accessible) water left in the dams (last year same time this stood at 384 and 300 M.cuM respectively).
Our target was to reach a “safe level” of 500+ M.cuM by mid-September 2017. But there is only some 7 weeks of usual winter left and it will now require torrential rain to reach this goal. Unfortunately there is nothing like that on the horizon. Climate predictions do not forecast anything other than normal average rainfall ahead.
How many days of water are left? Calculated arithmetically using the recently estimated water consumption rate of 6.2 M.cuM per week, the usable water left could theoretically last 25 weeks, i.e. 175 days, until mid-January 2018. And additional rains are sure to stretch out supplies.
However, this is becoming an inapproprate method of calculation as consumption will soon start to ramp up with the summer agricultural and holiday season. So we need to start modifying our assumptions. As things stand it does not seem likely that the dams will build up by more than 60 M.cuM of additional water and seem probable to end winter with a total of about 300 M.cuM in storage (= nominally 215 M.cuM of accessible water) available at end-September. If we apply water usage rates from last spring/summer season then that water would all be gone by end-January 2018.
Clearly such a situation cannot be left to chance!
What needs to be done?
The “wild card” is what steps authorities might take to relieve the situation. I believe that the main actions they could take should be:
- Assume that the dams will only build up to some 300 M.cuM of total water stored (= nominally 215 M.cuM of normally accessible water by end-September. If more rain arrives, rejoice!
- Plan to access another 4%-5% of the water in the dams (leaving only enough water to maintain the minimum biosphere), where practical installing additional filtration stages at the main water treatment plants to handle the sediment-laden (muddier) water that would flow, the aim being to increase total accessible water to around 260 M.cuM.
- Exhaust Voelvlei and Theewaters dams first – these shallower dams will have a higher evaporation index – to minimise such losses when the heat of summer arrives.
- Cut household consumption targets to <50 litres/pers/day; and cut agriculture and industry to 65% of allocations and/or water quantities used last season – leave them to then decide which least productive activities can/must be stopped and placed on maintenance only.
- Reduce the water allocation to all hospitality enterprises to just 60% of what they used last summer. They will have to decide if they can restrict their guests’ use of water or otherwise reduce the number of guests by 40%.
- Develop ways to encourage and support the installation of water tanks and roof rainfall harvesting at as many households and businesses as possible across the SW Cape. Draft and publish useful guidelines on how to plan/execute such installations. Make the program self-funding. Manage the supply-side/pricing and create employment.
- Mount a massive and sustained publicity campaign on all available media and channels to call on residents and businesses to reduce usage and to alert visitors to the crisis. Reduce water pressure in pipes wherever possible and institute rolling water outages once per month for two days at a time to drive home to everybody how serious the situation has become and to encourage water-saving practices. Couple this with some concerted, fearless enforcement into all corners of the Cape Town and SW Cape communities. Fast-track prosecutions.
- Carry on with installing aquifer boreholes to “produce” more water and, where possible commence recycling waste water for non-potable purposes (perhaps truck this lower quality water to where it can be used). If practical, continue to install modular desalination units and endeavour to hire a desalination ship. All these steps to act as stop-gap capacity to produce potable water to meet minimum personal needs if calamity strikes.However, these actions will at best collectively add one more week’s water to the overall supply by year-end, their main benefit starting to flow next year as the efforts ramp up sustainable extra water production.
By my calculations all this could probably see us reaching end-May 2018 with around 45-50 M.cuM accessible water still left in the dams, and at the same time keep operational 70%-75% of agriculture and industry and 80%+ of the hospitality industry (all = vital jobs).
Let the aim be assured survival with minimal community disruption, job losses and unrest. But action has to be taken really soon to maximise the extent to which water supplies are stretched.
Whatever is done, let us remember the astute observation that states “You won’t get out of trouble by following the same thinking that got you into trouble in the first place!”
What are the authorities doing now?
On 20 July 2017 City of Cape Town reported that it is studying over 100 RFI submissions for additional ways to produce fresh water (read more here) and are continuing interventions to abstract underground water and to recycle waste water.
Level-4B water restrictions are in force (read full details of restrictions and tariffs here). Essentially this mean reduce potable water usage to below 87 litres per person per day or less.
CoCT is preparing an operational plan for possible “Zero water” conditions; hopefully to be published within a few weeks.
What ought households to be doing?
Read my suggestions on how households can make themselves more water-resilient.
Bluntly, time is running out. There is still time to prepare your household to deal with a potential water shortage. But it is up to you – no one will do it for you. So if you take no action, then you will only have yourself to blame later.
Will the weather help?
 As predicted, there has been some light rain over the past 24 hours with some of it reaching up into the catchments. More had originally been expected but the High Pressure “mountain” once more intervened and forced the front to the south.
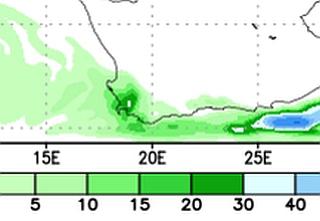
This NOAA chart shows the cumulative amount of rain that may be expected by 28th July.
Not much but all extra run-off will help.
 The next bout of useful rain is scheduled for the 2nd and 3rd of August.
The NOAA chart for the period indicates cumulative rainfall of some 25-35mm in the main dam catchments; once more with Wemmershoek, Berg River and both the Steenbras Dams benefiting most.
Initially the depression was predicted to be deeper and to hang around for longer. It may yet do so but there is also a chance that the high pressure cell will intervene and smash it.
What else may we expect?
No other major unstable weather systems are forecast other than for light showers from time to time through August and September. But this far out things can always change – we remain hopeful for more substantial rain; there is a thin possibility of a cut-off low developing over SW Cape on 6/7th August.
El Niño is becoming increasingly neutral and may now be ignored for our purposes.
Here is the latest historic rainfall chart for Cape Town Airport produced by UCT. The dark red line shows how little rain has fallen this year versus the historical average (the dark black line). Remember always that the dams are quite far away from the airport and experience different rainfall patterns. Find the latest chart here. [Thanks UCT].

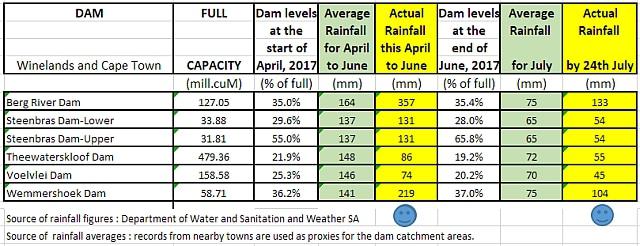
How much rain has fallen in the dam catchment areas? Useful rains fell with Wemmershoek and Berg River Dams benefiting most and Steenbras to a lesser extent. No rain fell at the Voelvlei and Theewaters dams, but the latter is still enjoying previous run-off. And some volumes of water are still being pumped across from Berg River to Theewaters dam.
Still it looks increasingly that July will end up tamely, with just on or below average rainfall.
In Summary: net inflows continued, with a modest 8.3 M.cuM rise in the dams levels, up from 26.1% to 27.0% of capacity. More rainfall run-off is expected but levels remain very low. Continued water savings is essential.
Here are the levels of the six main dams that serve the Cape Town/Overberg/Boland area. Also shown is the total water storage level of all the dams in the whole greater Western Cape.


Read our Indoors Water Savings Ideas here.
Read our outdoors Water Savings Ideas here
Read about a D-i-Y household rainwater harvesting and tank system here
Our water-wise landscaping and water-wise gardening suggestions.
Read about South Africa’s desalination policies and initiatives.
Click here to see Winelands Weather forecast of possible near-term rain.
Report instances of piping failures and incorrect use to municipalities.
In Cape Town the contact details of the 24-hour Technical Operation Centre are: Email: waterTOC@capetown.gov.za Telephone: 0860103089 (choose option2: water-related faults) or SMS: 31373 (max 160 characters).
Note: To calculate number of days of water left we first reduce reported water stored volume by 10% of capacity (i.e. 89 Million cuM) to allow for water that usually can’t be extracted or processed and then divide the remainder by the net outflow rate during the previous week.
Tom.
Views expressed in this article, and comments in response, are those of the writer and commenters alone and do not necessarily reflect the views and opinions of ShowMe, nor is any warranty hereby given as to suitability for any purpose of a reviewed enterprise or as to the quality of offered advice, products, services or value. Copyright ShowMe Paarl. All rights reserved. Copy only with prior permission.
Related Articles


