


Cape Dams Levels – weekly report (002)
ShowMe Winelands
Cape Dams Levels – weekly report nr. 002
as at 5th November 2018

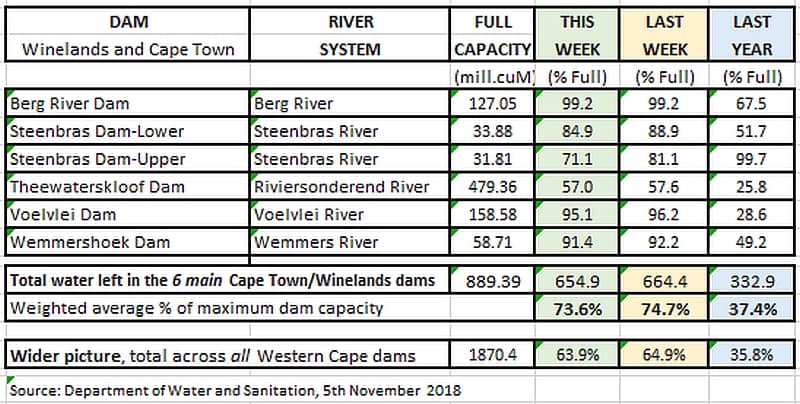
Here are the levels of the six main SW Cape dams, as reported by DWS for the week. Last week net outflows of 9.5 M.cuM reduced total volume of water stored to 654.9 M.cuM; i.e. from 74.7% to 73.6% of overall capacity.
By comparison, during the same week last year the total volume stored fell by 5.8 M.cuM (0.7%)
Note that there was an error in the DWS figures reported last week. The effect was to show a smaller decrease that previous week than actually happened, while overstating the decrease last week. However, the progressive situation of total water stored is now back on track.
.
The following chart shows the weekly change in the total amount of water stored [the green line bottom left hand side on the graph]. It can be seen that, due to the unrelenting heatwave experienced during the second half of October, water consumption from all sources in the Metro spiked sharply to 593 ML/day a week back and moved into the same range that consumption stood at in 2016 (grey area).
But last week daily consumption in the Metro dropped back to 559 ML/d, much in line with consumption during the first half of October when the new level-5 restrictions came into effect. And this is perfectly OK as we have more than sufficient water in the dams to support this usage.
 [click on the graph to see an enlarged version]
.
This is the time of year when DWS runs its models to determine how the available water should be best allocated among the various users. Revised allocations should be gazetted before November month-end and will form the basis upon which the municipalities and the Metro will set their water restriction levels for the coming summer.
Many residents in the SW Cape will have enjoyed some light general rain over the past few days. This small low pressure area is expected to roll on along the Cape South coast, hopefully helping quell the fires burning there.
There may be a passing shower here and there early next week but no other significant rain is predicted for our area for the coming few weeks. Thereafter some occasional rain is forecast for 19/20th November. But November can often surprise, so more rain may yet arrive.
To remain fully informed you may like to check the following items weekly
- City of Cape Town weekly “Water Dashboard“, to be found here.
- Our 7-day & 24-hour weather report here shows probable rain in Boland dam catchments.
- SA Weather Services current Synoptic Chart here showing the currently developing weather.
- Look at our supporting current monthly report here.
Tom Brown. Retired international businessman with a background in Finance and IT; and now a fruit farmer, with a passion for the weather and climate. Views expressed in this article, and comments in response, are those of the writer and commenters alone and do not necessarily reflect the views and opinions of ShowMe, nor is any warranty hereby given as to suitability for any purpose of a reviewed enterprise or as to the quality of offered advice, products, services or value. Copyright ShowMe Paarl. All rights reserved. Copy only with prior permission.
Related Articles


