


Cape Water and Dams Report

(Wolwedans Dam. Now at 84% of capacity. Photo : DWS)
Dams – Latest levels: Winelands and Cape Town
Report nr. 108 (updated 18th June 2018) on the main dams serving
Cape Town City and nearby Boland/Overberg towns
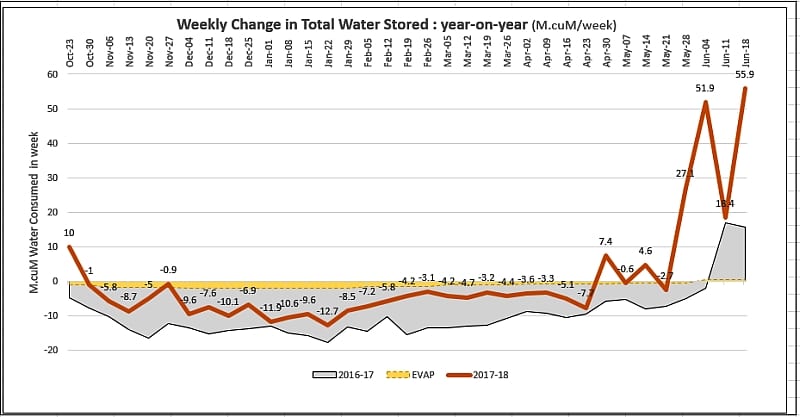
Another great week! Rains fell in all the dam catchments causing a further sharp rise of 55.9 M.cuM (6.3%) in the combined levels of all the main reservoirs. Total stored water volume increased from 31.5% of capacity to 37.8%.
During the same week in 2017 the dams rose by only15.7 M.cuM (0.3%) to 22.7% of capacity.
How long will the water last?
A mid-month correction increases the volume of water that I now expect to flow into the dams this month to 116 M.cuM of water. This would see us reach end June with 378 M.cuM in storage.
Very satisfying, but still a long way short of the 500 M.cuM that we must reach if we are going to be able to supply agriculture with most of its normal annual allocation of 160 M.cuM of irrigation water and still have enough water left to cope with our summer residential and business demand.

(Here is our model predicting the amount of water likely to be stored in the dams by mid-year.)
Putting it into context!
As can be seen from the CoCT graph below, 2018 is starting to look like 2013, which was an average rainfall year that lifted the dam levels by some 350 M.cuM over the full winter season. If that were to happen this year then we would end winter with some 550 M.cuM of water in storage. This would be far safer than in 2017, but still too little to significantly ease water restrictions.
The fact of the matter is that while the rains have been early and strong, it is only Voelvlei and Wemmershoek dams that have received above-average rainfall to date. Rains at the other dams are on or below the past averages according to the graphs produced by UCT.

As a small aside, we tend to use the word “dam” imprecisely in South Africa. Correctly, a dam is any barrier across a river or watercourse that causes water to be held back whereas a “reservoir” is a man-made lake or water body – usually behind a dam – that contains and stores water. We are inclined to refer to the combined object, dam and reservoir, simply as ‘a dam’.
The overall water usage picture improved this week with total use from all sources down again to 520 ML/d and water drawn from the dams by the Metro further reduced to 487 M.cuM. This implies a net increase in extra water flowing from the augmentation efforts to 33 ML/day; equal to the previous best contribution.
See our report on the status of Cape Town City’s augmentation efforts here.

(Graph tracking overall use and production of extra water through the augmentation efforts).
How well are we actually doing?
Our position at red ‘X’ shows combined level of the dams still climbing steeply, passing through the best level attained in 2017 (this particular chart will then no longer be useful and will be retired).
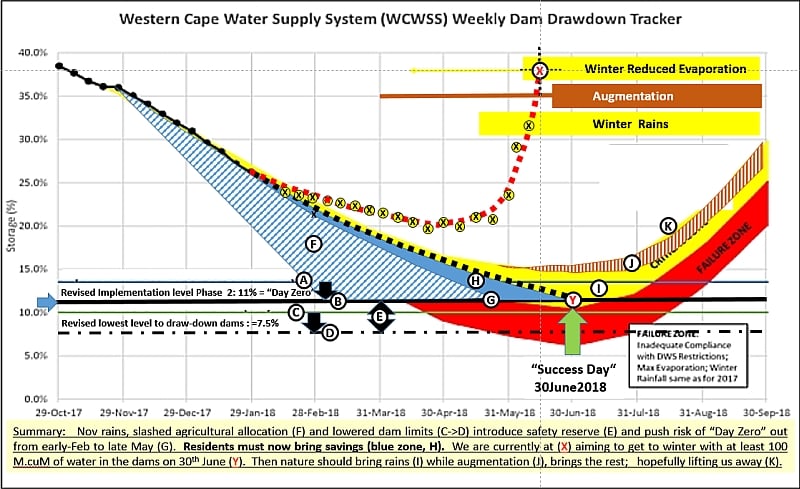
(See here for a detailed explanation of how the chart is to be read).
Interestingly, although the inland irrigation dams, Brandvlei and Kwaggaskloof, are also starting to fill it is the Clanwilliam Dam on the Olifants River that has done the best of them all: having been only 6% full a few weeks ago, it rose by an impressive 16% last week to reach 36.3% full.
Will the weather help?
Once more, extremely good rains fell in the catchments. With the ground now thoroughly saturated the water runs off quickly without much sinking away. The recent rainfall has tended to favour the eastern and north-eastern part of the SW Cape, but all the dams have shown good improvements.
This is the rainfall recorded at the various dams’ weather stations from April 2018 to date.

.
What rain ought we to expect? 
1) This SAWS synoptic chart shows a steady on-flow of low pressure systems. At this stage the South Atlantic High has withdrawn equator-ward allowing the lows to strike and penetrate. Unfortunately the cores of the next few lows are passing far to the south so only light and scattered rain can be expected over the coming few days.

2) On 23rd/24th June a water-laden front will pass over the Cape bringing 15-25 mm rain to some areas.
Behind this is a really deep and vigorous low pressure system, but unfortunately this may not have much impact as the High is expected to ridge in and deflect this system away to the south.
3) More rain is expected between the 2nd and 6th of July and during the first week on August when an unstable system should bring 20-30 mm of rain accompanied by thunder storms.
No large weather systems are currently predicted to strike the Cape during July and August.
Could it be that we may enjoy these good early rains only to find that the coming months are not as generous and bring less rain than we hope for? I mentioned earlier that the weather patterns seem to be shaping up similar to 2013. ENSO is also showing a similar pattern to that of 2013.
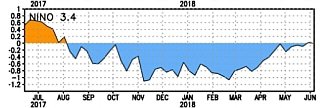 Clearly from this NOAA/CPC chart, the La Nina condition has faded back into neutral range. One can see that back in low-rainfall 2017 by July a full-on El Nino was in place. In 2018 the La Nina has lasted far longer which may have helped bring early rains.
Warmer El Nino conditions are expected to emerge over the coming months. There is a danger that this may dampen the rains and reduce the possible gain in water stored over the coming months. After such a good start to winter, it would be a shame if the rest of the season did not fulfil its promise and if the final gains in the dam levels turned out to be less than is currently hoped for.
Once more, this underlines why it remains so important to maintain water saving habits through until the end of October.
What are the authorities doing?
The City of Cape Town last month approved a number of amendments to the Water By-law. The City encourages residents to familiarise themselves with what is required of them in terms of this legislation.
Level-6B water usage restrictions remain in place but certain time limits for watering are amended.
The main take-aways regarding water conservation fittings for new property building and developments hat need to be borne in mind are:
1) New developments must install water conservation and demand management systems, or alternative water systems, and these must be approved by the City before development proceeds
2) Maximum capacity for toilet cisterns and shower head flow has been lowered. Toilets are now only allowed a maximum 6 litre cistern volume (down from 9 litres), and water from shower heads must flow out at no more than 7 litres per minute (down from 9.5 litres/minute. The maximum flow rate from any tap installed in a wash basin may not exceed 6 litres per minute
3) No cross-connection must exist on private property between potable and non-potable water systems
Then, fairly; residents should note that property owners are not required to comply with this By-law by altering a [existing] water installation or part thereof which was installed in conformity with a previous version of the By-law. Only when it comes time to replace toilets and shower heads due to age or malfunction must new parts that conform with the revised standards be fitted.
Read the full City Cape Town release about Water By-law amendments here.
Read here about Cape Town’s reduced water and sanitation tariff increases.
Here are the levels of the six main dams serving the Cape Town/Overberg/Boland area. Combined levels rose from 31.5% to 37.8% of capacity.

.

Plan ahead for possible water outages; here are points that could help you.
Read our Indoors Water Savings Ideas here.
Read our Outdoors Water Savings Ideas here
Read about a D-i-Y household rainwater harvesting and tank system here
Read about South Africa’s desalination policies and initiatives.
Click here to see Winelands Weather forecast of possible near-term rain.
Report instances of piping failures and incorrect use to municipalities.
In Cape Town the contact details of the 24-hour Technical Operation Centre are: Email: waterTOC@capetown.gov.za Telephone: 0860103089 (choose option2: water-related faults) or SMS: 31373 (max 160 characters).
Tom Brown.
Retired international businessman with a background in Finance and IT; and now a fruit farmer, with a passion for the weather and climate.
Views expressed in this article, and comments in response, are those of the writer and commenters alone and do not necessarily reflect the views and opinions of ShowMe, nor is any warranty hereby given as to suitability for any purpose of a reviewed enterprise or as to the quality of offered advice, products, services or value. Copyright ShowMe Paarl. All rights reserved. Copy only with prior permission.
Related Articles


