


Cape Water and Dams Report

(Bullshoek Dam. Now at 75% of capacity. Photo : DWS)
Dams – Latest levels: Winelands and Cape Town
Report nr. 107 (updated 11th June 2018) on the main dams serving
Cape Town City and nearby Boland/Overberg towns
Continued improvement! Further rains fell in all the dam catchments bolstering run-off from the previous week and raising combined water storage levels by a solid 18.4 M.cuM (2.1%), favouring Voelvlei and Wemmershoek. Total stored water volume increased from 29.4% of capacity to 31.5%.
During the same week in 2017 the dams rose by a similar 16.3 M.cuM (0.3%) to 19.1% of capacity.
June 2018 has started much as expected for this time of year. This is the month in which dam levels usually start to rise as recharge commences. Good rains building on the excellent start last month.

How long will the water last?
Our new target for end-October 2018 is to get the combined level of the main dams up into the 500 M.cuM range or better in order to permit a normal allocation of 150 M.cuM of water to agricultural irrigation and still have sufficient for business and residential use across the summer.
Given normal June rainfall, my expectation is that we should get to end of June with some 300 M.cuM of water stored.

(Here is our model predicting the amount of water likely to be stored in the dams by mid-year.)
Putting it into context!
To achieve our goal we need net inflows of 50 M.cuM per month over the coming 4 months and double that (i.e. net inflows of 100 M.cuM monthly) if we hope to see restrictions eased in November.
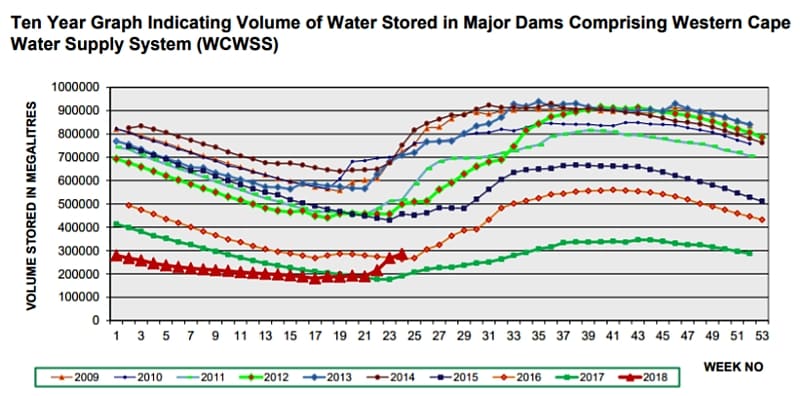
This CoCT chart shows the continued lift in dam levels over recent weeks. And, although it may well feel good, if one excludes the past three dry years then it can be seen that the rainfall we are experiencing is presently exhibiting a fairly normal pattern.
Although it will be natural to relax a little now that it is raining normally – and water consumption in the Metro has ticked up slightly – it is great to see that usage has in reality increased very little, meaning that the residents of the SW Cape are doing a sustained good job of sticking to the targets.
Overall water used from all sources firmed up again this last week – maybe those morning showers are running a bit longer while we wait for the colder water to warm up. On the other hand the amount of water produced through augmentation efforts declined slightly back down to 30 ML/day. See our report on the status of Cape Town City’s augmentation initiatives here.
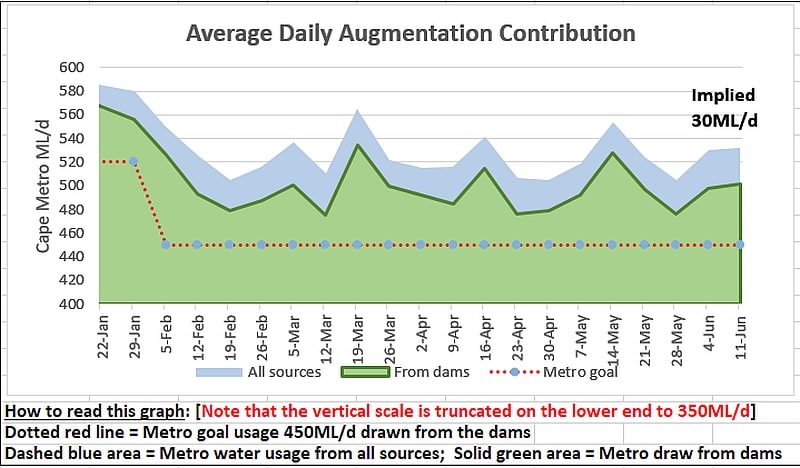
(Graph tracking overall use and production of extra water through the augmentation efforts).
Looking back, it is sobering to think how close the City came to disaster.
Consider this, if the 100 M.cuM of water was not held back from agriculture across Jan-Feb then “Day Zero” would have been implemented already by the beginning of March, 2018. Even with the good early rains that we have since received, rationing would still have been in place right now and we could have been entering our 11th week of standing in line for our 25L/p/d. Frightening!
Furthermore, if the exceptional May rains not arrived it is unlikely that extra water production could have covered the shortfall – we could by now have been in a very perilous situation indeed of having less than 70 M.cuM of water left in the main dams. It was a very close run thing!
How well are we actually doing?
As usual our position is at red ‘X’ on the following graph, still climbing strongly away from near-term danger levels. The main disappointment is that the extra water expected to be produced through augmentation has not materialised yet.

(See here for a detailed explanation of how the chart is to be read).
It is worth noting that both the Olifants and Breede River systems have been flowing strongly so the vitally important large inland irrigation dams at Clanwilliam (20.4%) and Brandvlei (18.8%) are starting to fill steadily, pointing to some relief for the irrigation farmers.
Why is this important? Last week we learned with shock that the contribution of agriculture to the South African GDP had dropped by a whopping 24%, causing the country’s growth to stall. There are many reasons for the fall in confidence and drop in investment in agriculture; but the lack of water is certainly taking its toll in the SW Cape. Agriculture is a vital rural employer and the key contributor to national food security – it must be carefully protected.
Will the weather help?
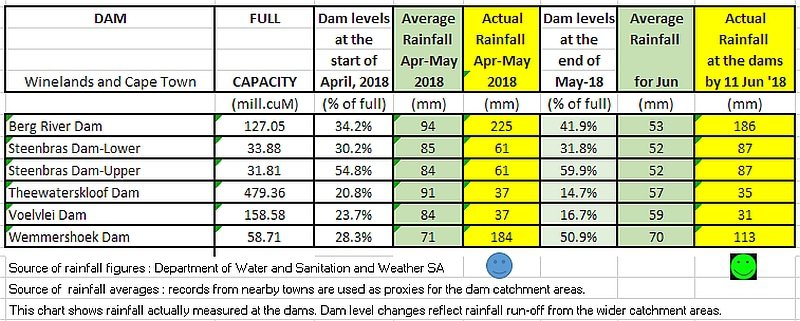
Precisely as predicted, there were again good falls of rain in the catchments, with all except Theewaters getting good rain, with TWK still benefiting from run-off through the Sonderend River. In anticipation of very solid rains to come later this week, DWS is currently moving water from Berg River Dam to TWK. Note also that TWK benefits from water transferred from Banghoek and Wolwekloof.
Here is the rainfall recorded at the weather stations located at the various dams for the period April 2018 to date. Main beneficiaries were Berg River and Wemmershoek dams, with Voelvlei Dam also doing well.
A few days back I was asked an interesting question by Richard Van’t Slott to the effect ‘which is to be preferred, snow or rain’. I certainly am not aware of any studies about this in our warm climate. But whenever I have thought about this I have come to the personal conclusion that rain is better, but snow does certainly have some advantages. Let us consider some pros and cons.
But first a useful fact – fresh snow has a density of around 50 kg/cuM (versus water at 4degC = 1,000 kg/cuM). This density will increase as the depth of snow increases, reportedly reaching around 200kg/cuM at about three metres depth. With time, greater depth and more pressure the snow should gradually become increasingly dense and finally change to ice at freezing temperatures around 0degC with a density of 916 kg/cuM (lighter than water, which is why it floats in your brandy).
Therefore, a cubic metre of fresh snow equates to only a 20th of a cubic metre of rainwater.
In countries where snow is much heavier and sustained, as many of you would know, it piles up and can last all the way through to spring before the thaw converts it progressively back to water, allowing it to enter the rivers and dams. In fact in countries like Switzerland, India and many others at high latitudes and/or with high mountain ranges where glaciers form they enjoy snow-melt all year round providing them with great fresh water security and often hydro-electric energy as well.
However, it requires large, deep and sometimes permanent fields of snow for the full benefit to be derived. In South Africa we have no permanent snowfields or glaciers – our snows tend to be light and ephemeral, usually a dusting here and there but not sticking around for long and usually quickly melting away as soon as the temperature normalises; even in deep winter. Accordingly snow only rarely stores much water for us and therefore plays no meaningful role in our water security.
Advantages of snow are that it evaporates very little and acts as a store of water that is released later in a steadier, potentially less harmful way. But because of this slow melting process more of the snow-melt water is likely to soak away into the ground and may never reach the rivers and dams.
I feel that rain, on the other hand, while also soaking into the ground, is likely to run off more quickly into the dams where, of course, it may be more susceptible to evaporation. And the harder the rain the faster the run-off, with the possible negative effect of flooding and erosion damage.
My preference? In our climate I would rather take the rain right away and get it into the dams. Will there be much difference? I doubt it, but would love to hear from climatologists as to which they think would be better, and why? Let’s have your comments. Which is better, rain or snow?
What rain should we expect?
1) The impending weather system has accelerated and is now predicted to strike the Cape earlier on morning of Thursday 14th. It is expected to rain solidly for 36 hours, first easing on Friday evening before restarting the following Monday.

The South Atlantic High has, as forecast, moved away, so this deep front will strike the SW Cape full-on with the barometer dropping into the range of 1004 Mb.
It should be accompanied by strong NW winds which may push good rainfall of 80-100 mm into all the catchments, with TWK likely to enjoy much better falls this time.
The NOAA/CPC chart for this week indicates where the heaviest rain may fall.
2) Another burst of rain bringing 50-80 mm of rain could strike on Monday 18th.
3) Shallower systems will flick past on 21st and again on 24th with more useful rain expected around the 26/27th June.
All in all a great month of sustained winter rain lies ahead.
What are the authorities doing?
Last week CoCT issued a statement regarding pressure management advantages. “The City’s pressure management programme is now achieving savings of 62 million litres of water per day by lowering pressure across the metro. Not only does pressure management generally lower consumption by reducing the rate at which water flows to properties, it also reduces leaks and pipe bursts by ensuring that pressure remains within levels that the pipework can tolerate, and reduces the rate of loss from leaks and bursts.”
This is an interesting claim so I posed some questions of the Water and Sanitation team which were answered as follows by Peter Flower, Director: Water and Sanitation, City of Cape Town.
Q. How is that amount of “62 million litres per day” established and calculated versus what the ‘normal’ consumption would be in the absence of such pressure reductions.
A. The lowered usage of 62 ML per day runs across 86 pressure management zones across the city. A pressure reducing valve (PRV) and meters have been installed at the inlet supply point of each zone/area which allows us to drop pressures and measure flow rates within the zone.
A data logger is installed at the PRV station which allows pressure and flow to be measured and monitored continuously online.
Before pressure is reduced within a zone, a baseline measurement is recorded to understand and review the zones initial demand and pressure. Once the pressure has been reduced within the zone the initial measurements are compared to the final measurements within the zone and used to calculate the saving.
Q. Does that mean that the total water production from all sources published on 4th June 2018 of 530ML/d would otherwise have been 592ML/d were it not for the saving calculated as being due to pressure reduction.
A. Yes, it essentially does.
Q. May it be assumed that the City’s residents would therefore actually be continuing to use around this 600 ML/d level if some residents were not being forcibly deprived of water through this pressure reduction method.
A. Yes, it should be noted, though, that the impact of pressure management is in its assistance to consumers to reduce their consumption and in reducing the leakage rate. Other than that it doesn’t in of itself save water.
Q. Is this pressure reduction management now applied evenly across the metro or are some areas subjected to it and others not?
A.To date approximately 60% of the network is pressure managed. Design and construction processes are currently under way on new pressure management zones which will increase the coverage to 85% by the end of August 2018. The intention is to ultimately cover all high pressure areas of supply in the metro.
Q. And if this is now controllable, on what basis is pressure reduction imposed when it is imposed?
A. The City has been implementing pressure management for more than 10 years now and has prioritised the implementation of pressure management according to the areas which have experience the highest losses or pressures, leading to burst pipelines. Under drought conditions this programme has been accelerated and the pressure reduced further to support a reduction in consumption.
To me there were two important takeaways from these responses.
– Firstly, pressure management isn’t a controlling mechanism but rather a way in which the City assists consumers to sustain a lower water consumption rate; and, indirectly, reduce their costs of water. It also reduces water losses.
– Secondly, the City carefully measures water flows before and after the implementation of pressure management and so it can be reasonably sure of the actual savings achieved due to the reduced pressure.
This is very significant: 62 ML/d is a saving of over 10% of the water that would otherwise be used, or lost at this time. Eventually this saving could become equivalent to adding extra storage capacity the size of Steenbras Lower Dam to the system. I’m impressed. Well done Cape Town City Water Management.
Read here about Cape Town’s reduced water and sanitation tariff increases.
Here are the levels of the six main dams serving the Cape Town/Overberg/Boland area. Combined levels rose from 29.4% to 31.5% of capacity.

.

Plan ahead for possible water outages; here are points that could help you.
Read our Indoors Water Savings Ideas here.
Read our Outdoors Water Savings Ideas here
Read about a D-i-Y household rainwater harvesting and tank system here
Read about South Africa’s desalination policies and initiatives.
Click here to see Winelands Weather forecast of possible near-term rain.
Report instances of piping failures and incorrect use to municipalities.
In Cape Town the contact details of the 24-hour Technical Operation Centre are: Email: waterTOC@capetown.gov.za Telephone: 0860103089 (choose option2: water-related faults) or SMS: 31373 (max 160 characters).
Tom Brown.
Retired international businessman with a background in Finance and IT; and now a fruit farmer, with a passion for the weather and climate.
Views expressed in this article, and comments in response, are those of the writer and commenters alone and do not necessarily reflect the views and opinions of ShowMe, nor is any warranty hereby given as to suitability for any purpose of a reviewed enterprise or as to the quality of offered advice, products, services or value. Copyright ShowMe Paarl. All rights reserved. Copy only with prior permission.
Related Articles


