


Cape Water and Dams Report
Dams – Latest levels: Winelands and Cape Town
Report nr. 104 (updated 28th May 2018) on the main dams serving
Cape Town City and nearby Boland/Overberg towns
Rains across the dam catchment areas lifted the level of combined water stored by 27 M.cuM, or 3%. Combined volumes stored rose from 20.7% of capacity to 23.6%.
During the same week in 2017 the dams dropped by 5.4 M.cuM (0.6%) to 19.4% of full capacity. So combined water stored is well ahead of the same time last year; a good outcome for mid-May.

How long will the water last?
If the rest of winter 2018 brings the same net volume of additional water as did winter 2017 then we should end this winter some 40 M.cuM of water (4.5% of capacity), 2 month’s supply, better off than we ended October in 2017. This would leave us safer for summer, but not hugely so.
As usual there is no change to this chart this week but clearly with the good rain that we have enjoyed we will close May with more water stored than at the start of the month.

(Here is our model predicting the amount of water likely to be stored in the dams by mid-year.)
Putting it in context!
These early rains have been good and most welcome. However, we will need one week of rain like last week during each and every month between now and October just to end up in the same water stored position as we did in 2017.
Or, put another way, it must rain like last week every second week from now until end-October if we hope to end winter with our dams just half-full.
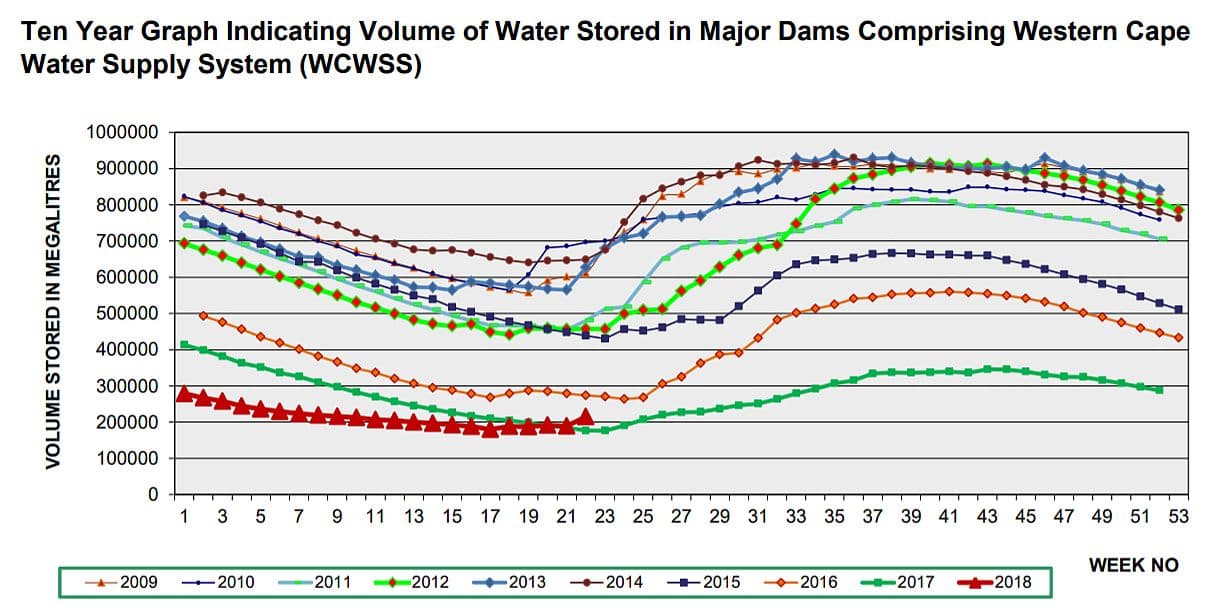
But we are doing better than last year. The massive reduction in water consumption combined with the early rains has resulted in every main dam now having more water in it than at the same time in 2017. This can be seen from the CoCT graph below that shows the 2018 line lifting above that of 2017; an unexpectedly good start to the winter. Indeed, it is looking increasingly possible that this may turn out to be a normal rainfall year in which case the combined stored water levels may rise up to at least similar levels as were achieved in 2016.
We certainly cannot relax our water-saving efforts yet and need to wait until end-August before we can be reasonably confident how this winter will turn out. Until then, keep saving water as you all have done up to now – a wonderful effort that directly ensured that “Day Zero” didn’t happen!
What of augmentation efforts?
The table below reflects the current situation of Cape Town’s augmentation efforts.
Keeping it in perspective, augmentation at best provides a minimum life-line in a survival situation but cannot be expected to make a significant contribution to fresh water supplies until end-2020.
Consider this: even if the initiatives outlined below all come to full fruition on the dates shown they will, across the whole of year 2018, produce only around one third of the surface run-off received from the rainfall into the dams last week alone. I.e. just two days of rain produced more water than is expected from all the augmentation efforts for the whole year 2018.
 (click for an enlarged picture)
Details of the augmentation plans are starting to crystallize. Why is this important? Well, once “what will be done by when” is set down, then a picture of available water volumes and costs begins to emerge. This in turn, enables the household, business and agricultural sectors to start to firmly plan and invest with more confidence. And from this, of course, comes activity and production resulting in growth, employment and improved general well-being. A clear picture eliminates uncertainty.
The emerging plan foresees a balanced array of extra water production initiatives. What are these?
– maximise water from existing and supplemental surface water systems (dams and rivers). This is mainly in the hands of DWS (see “authorities” below). [65 ML/d]
– groundwater abstraction from both the sandy Cape Flats and Atlantis aquifers as well as from the deeper TMG strata. This will likely be the second largest contributor of fresh water. The process has the added capability of being switched off when adequate surface water is available. [140 ML/d]
– recycling will extract usable water from existing waste water flows at an advanced processing facility planned to be built at the Faure waste water facility. [70 ML/d].
– at least one large scale permanent seawater desalination plant will be built, probably on the west coast, to provide around 120 ML/d of fresh water, both contributing to overall supplies and as a life-saving source in the unlikely event of failure of all the other water supply systems. [125 ML/d]
– an improved method to divert and harness storm water for aquifer re-charge purposes. [??]
During this process there has been a shift in emphasis from desalination toward groundwater (which is relatively more available, cheaper to access and quicker, easier to implement) and to recycling.
The augmentation effort has initially taken the form of groundwater abstraction from Atlantis, the three small temporary desalination plants at Strandfontein, Monwabisi and V&A Waterfront, and a small interim recycling facility at Zandvliet. Intended to provide water in an emergency and otherwise to test and prove the concepts, it is intended that all the temporary plants will be discontinued and replaced by permanent installations within three years.
Assuming reasonably normal average rainfall, it is expected that these steps together will provide water resilience and security for the SW Cape for 10-15 years.
Consequent on delays, the supply of extra water has risen only slightly to 29 ML/day during this past week. Improvement in augmentation flows should start to materialise soon as the temporary desalination production and groundwater abstraction ramps up. It is pleasing that the total use of fresh water in the Metro dropped back to the lowest levels previously achieved.
 (Graph tracking overall use and production of extra water through the augmentation efforts).
How well are we actually doing?
Our current position is shown at red ‘X’ on the following graph, i.e. at nearly 24% of total storage capacity. We have well exceeded our minimum requirements and on-going rains should add to the growing reserves.
This graph is losing relevance as we successfully avoid potential disaster and move into the wet season, so from next week we will shift focus to the longer term and to follow progress through winter and into the summer beyond.

(See here for a detailed explanation of how the chart is to be read).-
Will the weather help?
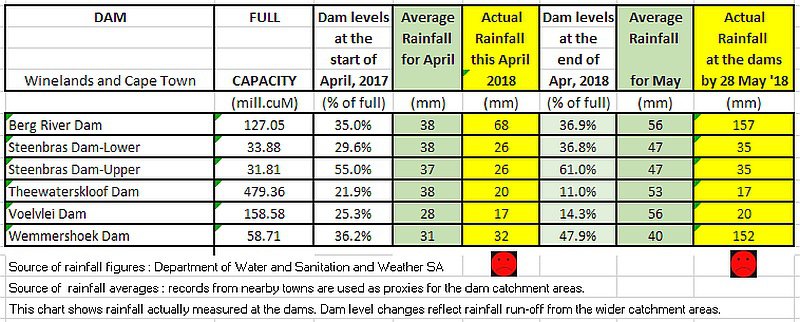
Rainfall patterns are closely following predictions with widespread rains being enjoyed and for the first time good rains falling in the catchments of Voelvlei and Theewaterskloof dams.
Here is the rainfall recorded at the weather stations located at the dams for period April 2018 to date
What rain should we expect?
1) Between 30th May and 2nd June thundery, unstable conditions are forecast to bring between 40 to 90 mm of rain to some areas and especially the catchments; with all the dams benefiting this time.
2) A system is predicted for 11/12th June bringing 20+mm to the catchments followed by a potentially extended unstable system ushering in thundery showers between 21st to 25th June.
3) July currently promises only occasional rain but more can be expected to develop the weeks pass.

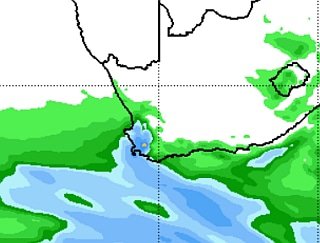
This current synoptic chart for today from SA Weather services shows the more normal “upright” approach angle of the cold front resulting in north-westerly winds bringing rain deeper into the inland areas and catchments.
Looking ahead to the rest of this week, solid rains are forecast with potentially up to 100 mm falling in the mountain catchments.
Voelvlei and Theewaters dams could once more benefit well, particularly on Friday.
What are the authorities doing?
Bulk water supplies are the responsibility of the Department of Water and Sanitation. So what is going on in that area?
Meet Erwin Weidemann, DWS Area Manager for Bulk water – normally for the Breede-Gouritz area, but presently also for the Berg and Olifants River systems.
It is Erwin’s goal to achieve water supplies as close as possible to the agreed water allocations and, together with his colleagues, to do what he can to overcome the water shortages plaguing the SW Cape.
He advises that several important bulk water enhancement initiatives are underway:
1) The (new) minister has approved the restart of the suspended effort to raise the wall of the Clanwilliam dam. Construction is scheduled to restart in October 2018 using DWS’ own construction team.
2) More importantly for the Metro and SW Cape municipalities, work will soon commence on the augmentation scheme that will pump surplus water from the lower Berg River up for storage in the Voelvlei Dam. The aim is to complete this project by April 2021 making an extra 30 M.cuM of stored water (equivalent to an extra Steenbras dam) available to the WCWSS.
3) A third initiative that is in planning aims to route water from a weir in Mitchell’s Pass back to the Klein Berg River and from there via canal to Voelvlei dam, potentially adding a further 10 M.cuM to the water supply system.
These initiatives are important both for the Metro as well as the West Coast municipalities that can be supplied by Voelvlei Dam.
Recognising that climate and weather patterns are changing, another initiative by DWS will be recalculation of yields and run-off to the dams to enable improved demographic planning. An interesting example cited by Erwin is that when the 5 M.cuM of water was recently released down the Berg River to Misverstand Weir, it was expected that only 50% of the water would make it all along the bone dry riverbed; but in the final analysis 70% of the water actually made it. This demonstrates the difficulty of estimating water flows in a drying environment. It also indicated the beneficial effects of the clearing of alien vegetation along the Berg River course and banks in recent years.
Read here about Cape Town’s reduced water and sanitation tariff increases.
Here are the levels of the six main dams serving the Cape Town/Overberg/Boland area. Combined levels rose from 20.6% to 23.6% of capacity.


Plan ahead for possible water outages; here are points that could help you.
Read our Indoors Water Savings Ideas here.
Read our Outdoors Water Savings Ideas here
Read about a D-i-Y household rainwater harvesting and tank system here
Read about South Africa’s desalination policies and initiatives.
Click here to see Winelands Weather forecast of possible near-term rain.
Report instances of piping failures and incorrect use to municipalities.
In Cape Town the contact details of the 24-hour Technical Operation Centre are: Email: waterTOC@capetown.gov.za Telephone: 0860103089 (choose option2: water-related faults) or SMS: 31373 (max 160 characters).
Tom Brown.
Retired international businessman with a background in Finance and IT; and now a fruit farmer, with a passion for the weather and climate.
Views expressed in this article, and comments in response, are those of the writer and commenters alone and do not necessarily reflect the views and opinions of ShowMe, nor is any warranty hereby given as to suitability for any purpose of a reviewed enterprise or as to the quality of offered advice, products, services or value. Copyright ShowMe Paarl. All rights reserved. Copy only with prior permission.
Related Articles


