


Cape Water and Dams – monthly report (125)
ShowMe Winelands
Cape Water and Dams – monthly report nr. 125
as at 29th October 2018
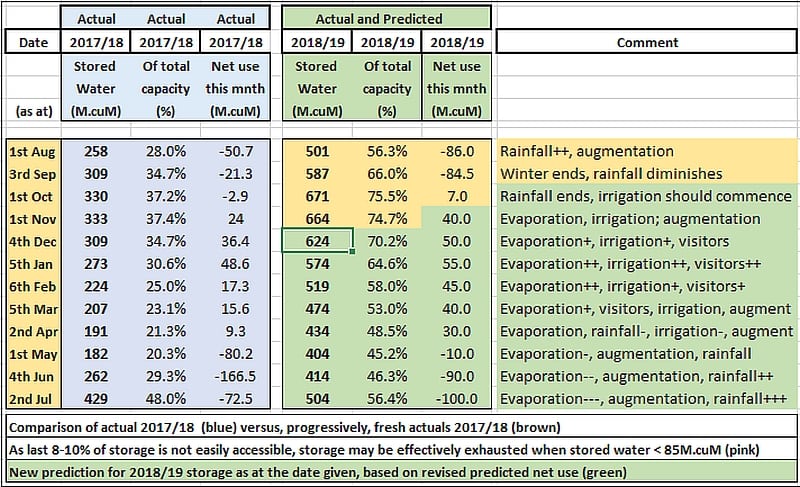 Here are the predicted levels of the total amount of water that could be stored collectively in the six main SW Cape dams at the end of each month through to next winter (green shaded area), following the actual levels for the year-to-date (brown shading), and compared with the actuals from the periods of the prior year (blue shading).
At the moment we are assuming a normal average weather and annual rainfall patterns, an easing back to level-3 restrictions and the full allocation of irrigation water to the agricultural sector.
The model currently indicates that combined dam levels could drop to around 400 M.cuM of water (from the present level of 664 M.cuM) by early May, 2019 and that thereafter replenishment of the dams would commence as winter rains arrive.
.
The following chart produced by City of Cape Town shows the progressive change in the total amount of water stored graphically indicates how we have got to this point as the winter rains have replenished the main dams.
 [click on the graph to see an enlarged version].
The shaded danger zones will now start to change their shape and should decline as the dry summer period passes and the following winter draws ever nearer.
.
Our weekly Cape Dams Levels report shows latest water consumption rates.
- See the latest Cape Dams Levels and changes in water used here.
Items that you should read quarterly to remain informed.
- To see what the Cape Metro augmentation water production program is achieving click here. These charts are updated quarterly.
- To be informed of climate issues affecting our lives check the noticeboard of the UCT Climate S A Group (CSAG) here for their latest papers on climate change and related matters.
Prevailing water restrictions
- Since 1st October 2018, are level-5 (70 litres/person/day)
Tom Brown. Retired international businessman with a background in Finance and IT; and now a fruit farmer, with a passion for the weather and climate. Views expressed in this article, and comments in response, are those of the writer and commenters alone and do not necessarily reflect the views and opinions of ShowMe, nor is any warranty hereby given as to suitability for any purpose of a reviewed enterprise or as to the quality of offered advice, products, services or value. Copyright ShowMe Paarl. All rights reserved. Copy only with prior permission.
Related Articles


