


Cape Dams Levels – weekly report (010)
ShowMe Winelands
Cape Dams Levels – weekly report nr. 010
as at 11th February 2019
 [Victoria Dam on Table Mountain. Currently 63% full. Photo: CT City]
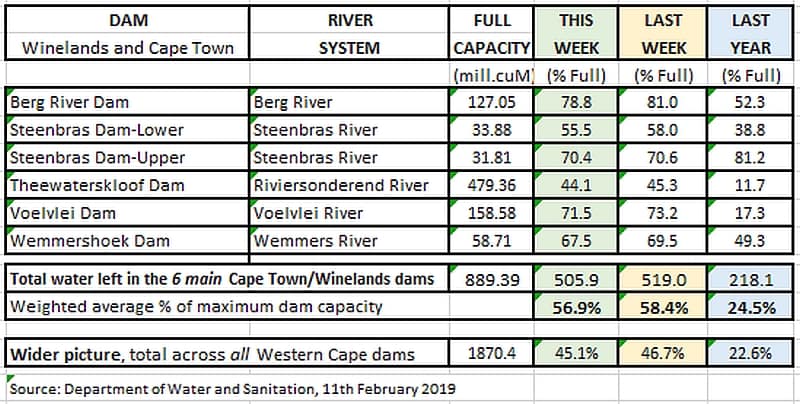
Net outflows from the main SW Cape dams lifted week-on-week to 13.1 M.cuM, 1.5% of capacity, and combined water in the 6 dams fell from 519.0 M.cuM to 505.9 M.cuM; i.e. from 58.4% to 56.9% of overall capacity. During the same week last year the total volume stored fell by a far smaller 6.0 M.cuM (0.67%).
Here are the levels of the 6 main dams. Note how vastly fuller both Theewaters Dam and Voelvlei dam are than they were at the same time last year.
 .
.
As visitor numbers decrease after the holidays, weekly net outflows ought to be declining. But the weekly usage figures have in fact climbed slightly which indicates that residents may at the same time be gradually relaxing their water conservation efforts, thereby causing overall weekly water consumption to rise toward levels expected in the Metro’s projections.
To date there has been no change in the published restrictions on water use.
.
In the graph below we track the weekly net change in the water stored collectively in the six main dams. Since the onset of the dry season, the weekly net outflows from the main dams in 2019 have tracked closely to net outflows during the same weeks in 2017-18.
Now, however, that situation should change in that we may expect the usage pattern from here onward to more closely follow the heavier consumption pattern of summer 2017 (black line) rather than that of summer 2018 (green line). Why is that? Well, in 2018 the supply of water to agriculture was cut off completely in February, whereas this year the flow of irrigation water to agricultural continues to follow the previous normal summer levels, for example as took place in 2017.
 [click on the graph to see an enlarged version]
Read here about the revised Cape Town water restrictions operative since 1st December 2018.
.
Weather patterns for the coming 6-10 weeks are currently predicted to be averagely warm and dry. Some light rain is expected around the 23rd of February (10 mm) and again during the first week of March (5 mm), while the second half of February is expected to be slightly cooler than normal.
One recent ‘MUST READ’ major report well worth your attention:
For those of you genuinely interested in the finer detail of how the water supply system in the SW Cape and the Metro are being developed and guided, I strongly recommend that you read the WATER OUTLOOK 2018 REPORT published 31st December 2018 by City of Cape Town, Water and Sanitation Department.
 The Executive Director of that department, Dr. Gisela Kaiser (right), has made great efforts to ensure that this year-ending report most accurately reflects the prevailing situation as well as on-going augmentation and bulk water storage improvement plans. It may be found here http://www.bit.ly/CCTrepDec18.
The City is expected to soon publish its Water Strategy document for comment, thereby keeping citizenry of Cape Town fully informed of directions the future supply of water to the metro might take.
.
To otherwise remain informed you may check the following items weekly.
- City of Cape Town weekly “Water Dashboard“, to be found here.
- Our 7-day & 24-hour weather report here shows probable rain in Boland dam catchments.
- SA Weather Services current Synoptic Chart here showing the currently developing weather.
- Look at our supporting current monthly report here.
Tom Brown. Retired international businessman with a background in Finance and IT; and now a fruit farmer, with a passion for the weather and climate. Views expressed in this article, and comments in response, are those of the writer and commenters alone and do not necessarily reflect the views and opinions of ShowMe, nor is any warranty hereby given as to suitability for any purpose of a reviewed enterprise or as to the quality of offered advice, products, services or value. Copyright ShowMe Paarl. All rights reserved. Copy only with prior permission.
Related Articles


